
Diagnose Changes in App Engagement
If you already use App Store Connect to monitor engagement, Sessions per Active Device is probably the number you know. When it rises, the devices that were active on a given day opened the app more often. The daily chart tells us when that changed, but the metric itself does not include visit length or the size of the active audience, and the overall trend can still hide differences between releases, device families, or sources.
The useful question is what changed alongside opening frequency. The App Sessions report type adds the duration and daily reach needed to see whether the movement reflects longer visits, a broader active audience, or a pattern tied to a release, device family, or discovery source.
Find What Changed
The first step is to follow that familiar number over time before trying to explain why it changed. In ConnectWizard, Sessions per Device reveals the days on which opening frequency rose or fell.
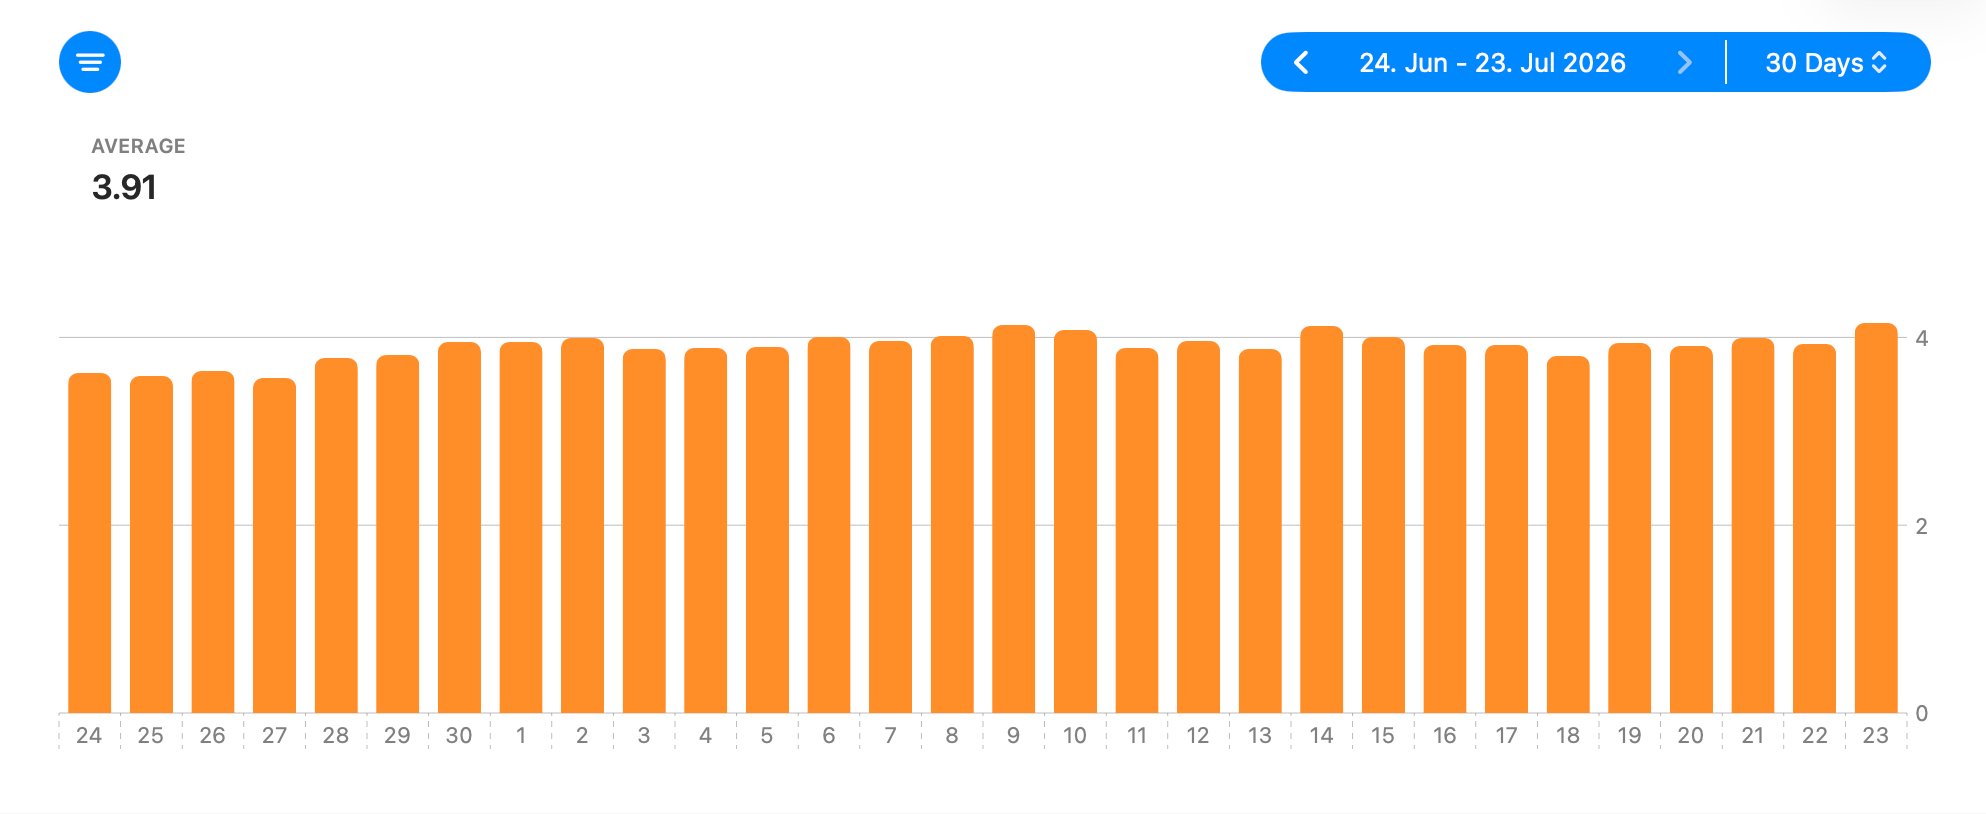
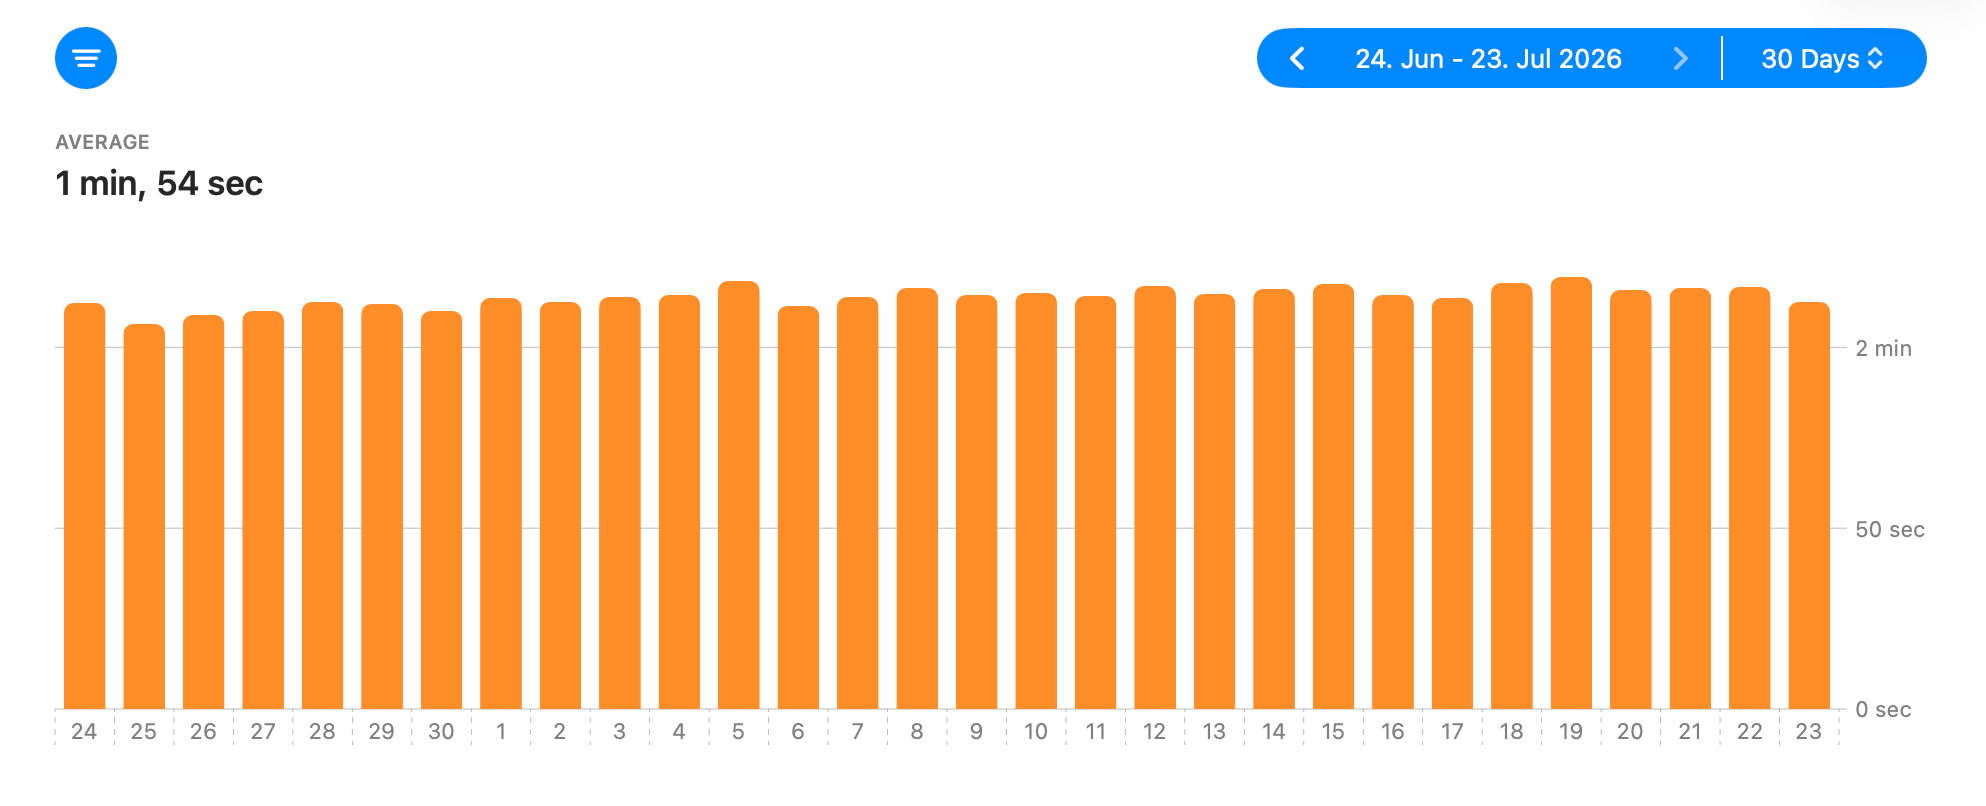
More frequent visits are not necessarily longer visits. Average Session Duration shows whether an individual session became longer or shorter on each day.
Frequency and duration describe how active devices use the app, but they do not show the size of the active audience. Unique Devices adds that context by showing how many devices contributed at least one session on each day.
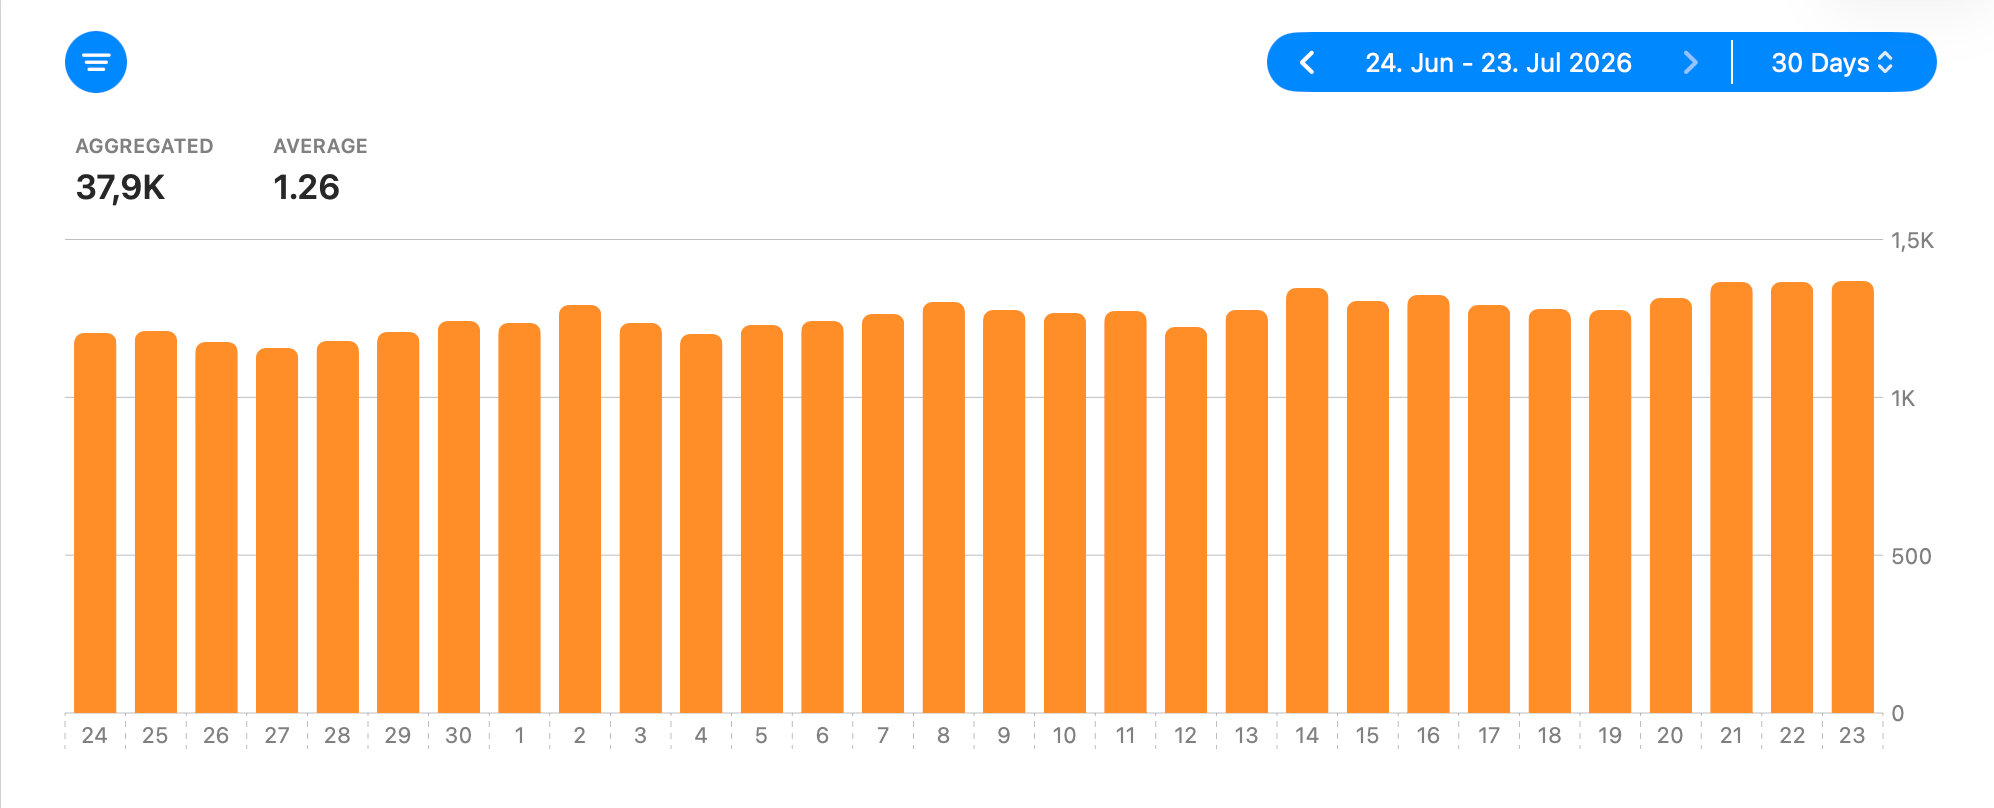
The relationship between all three measures gives the change a clearer meaning. Rising Sessions per Device with stable session duration points to more frequent visits, while rising duration with stable frequency points to longer visits. Unique Devices places both patterns alongside daily reach, so we can distinguish deeper use by the active audience from growth in the number of devices using the app each day.
These measures describe daily device activity rather than individual people or a distinct-device total for the whole timeframe. The same device can count again on every day it is active, a device can be shared, and one person can use several devices. Treat Sessions per Device as a daily engagement-frequency signal, not as a retention rate.
Check Whether a Release Changed Behavior
An app update is often the clearest explanation for a sudden change in engagement. Devices by App Version shows which releases account for enough daily device activity in the selected timeframe to make a comparison meaningful.
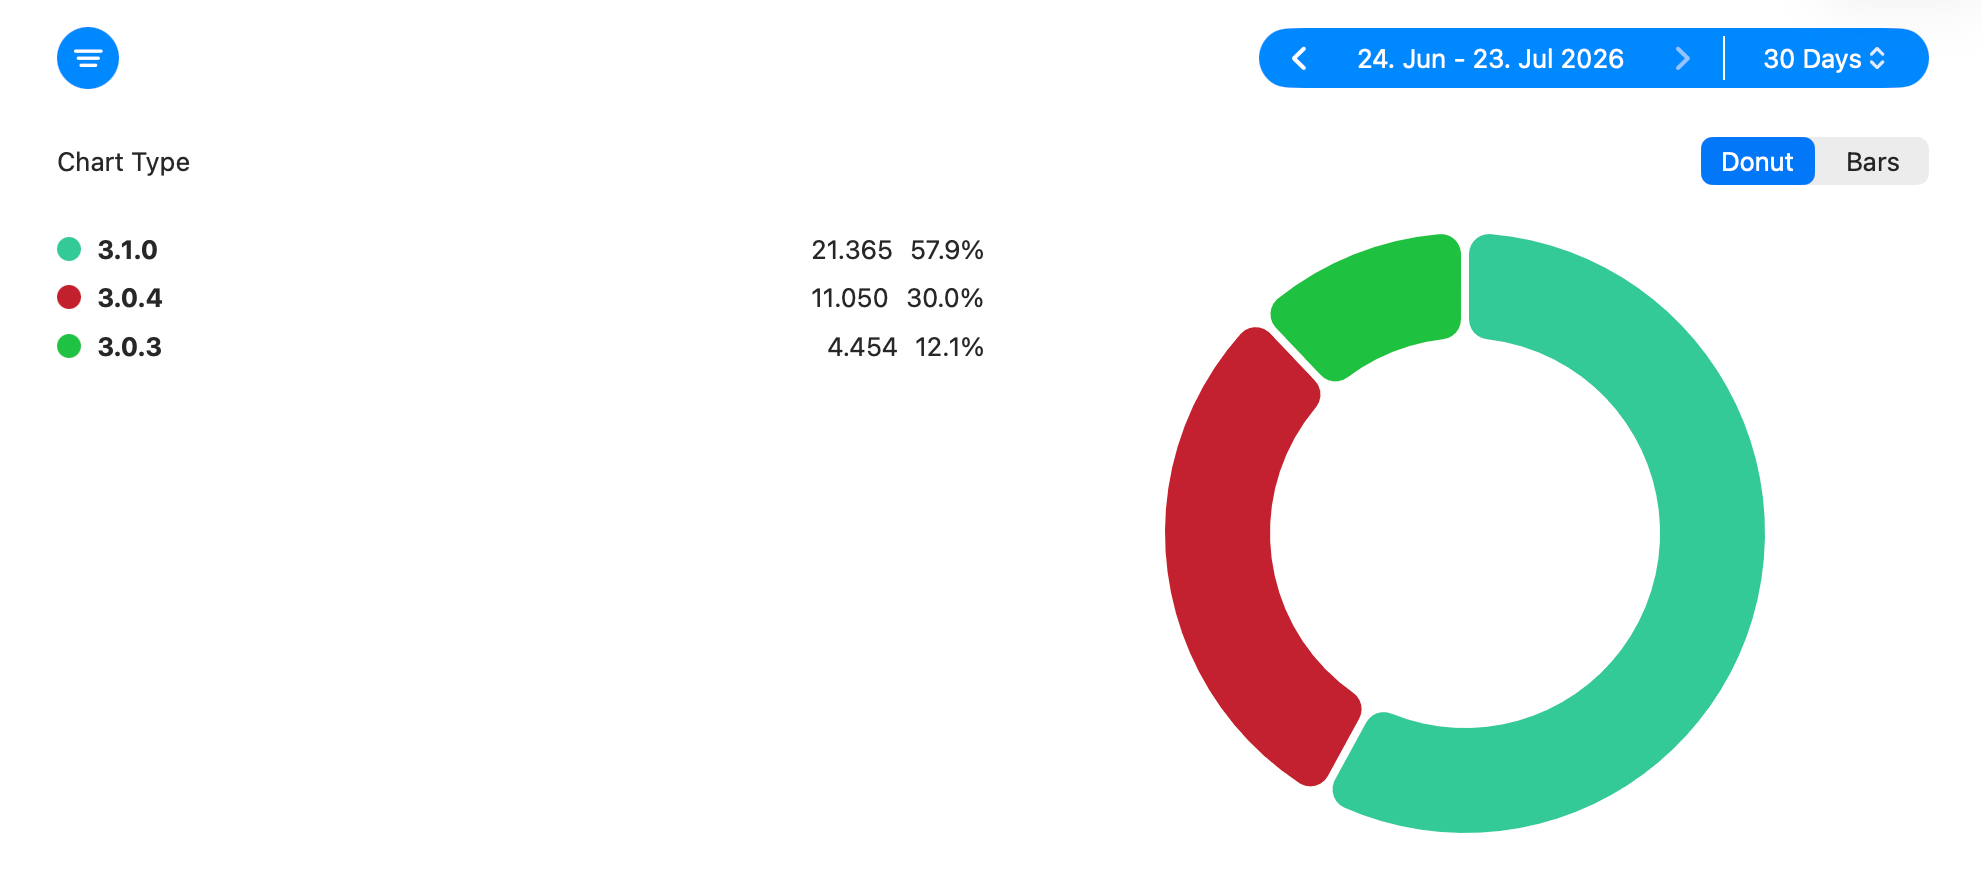
Rollout context matters because a small group of early adopters can behave differently from the broader audience. A device active on seven days contributes seven daily counts, so this distribution is context for the analysis rather than an exact measurement of distinct installed devices or rollout adoption.
Once the latest version has meaningful activity, compare how often and how deeply it is used. Sessions per Device by App Version shows how frequently each release is used on an average active day, while Session Duration by App Version shows the average length of one visit.
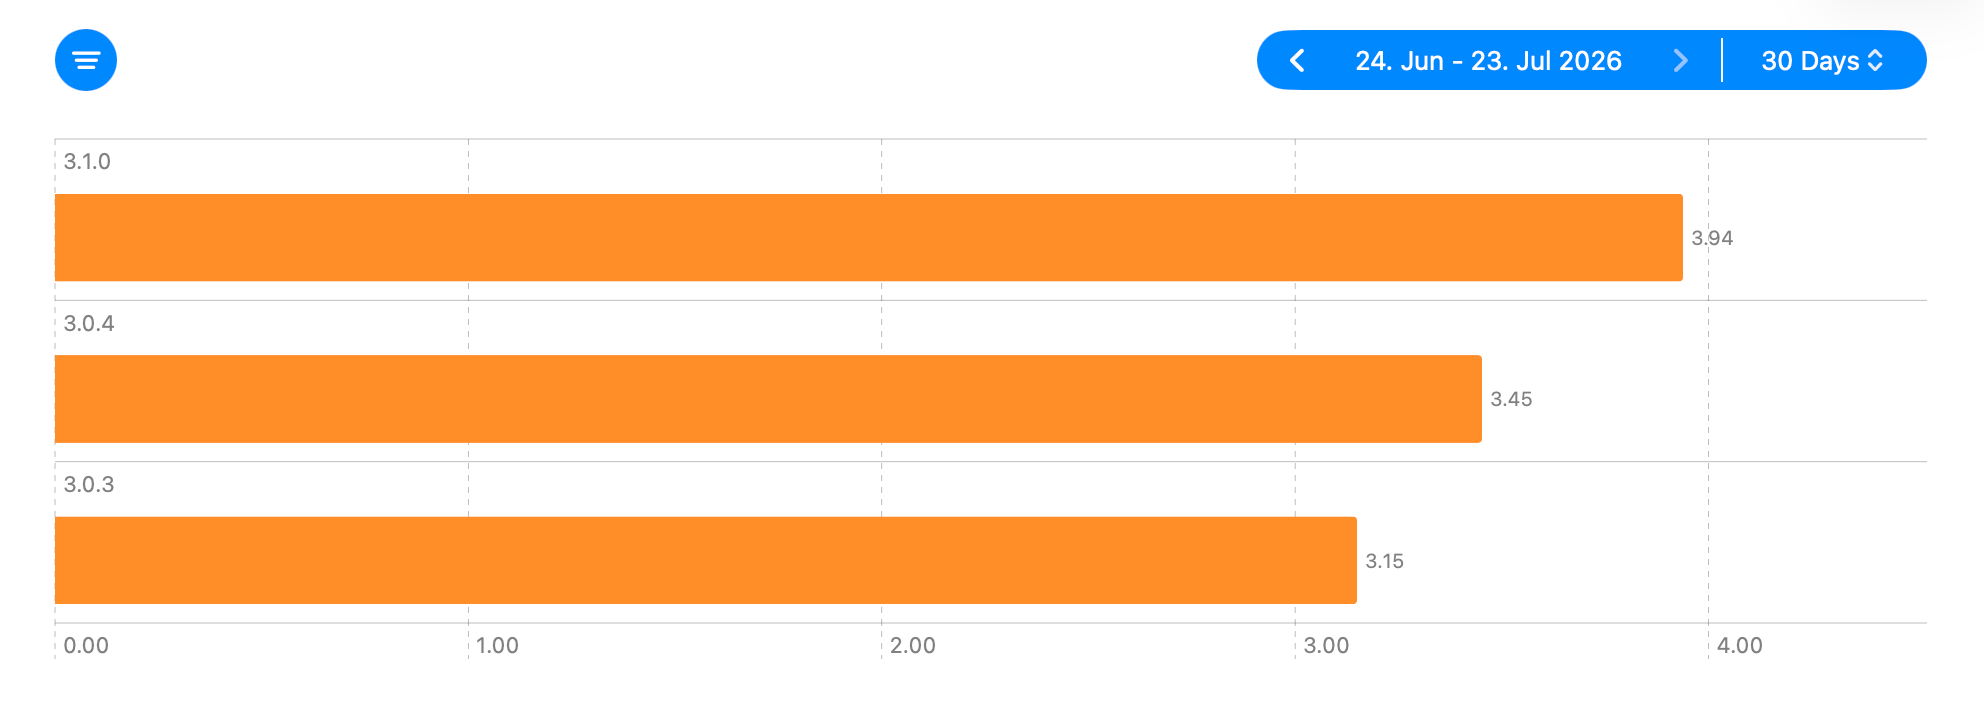
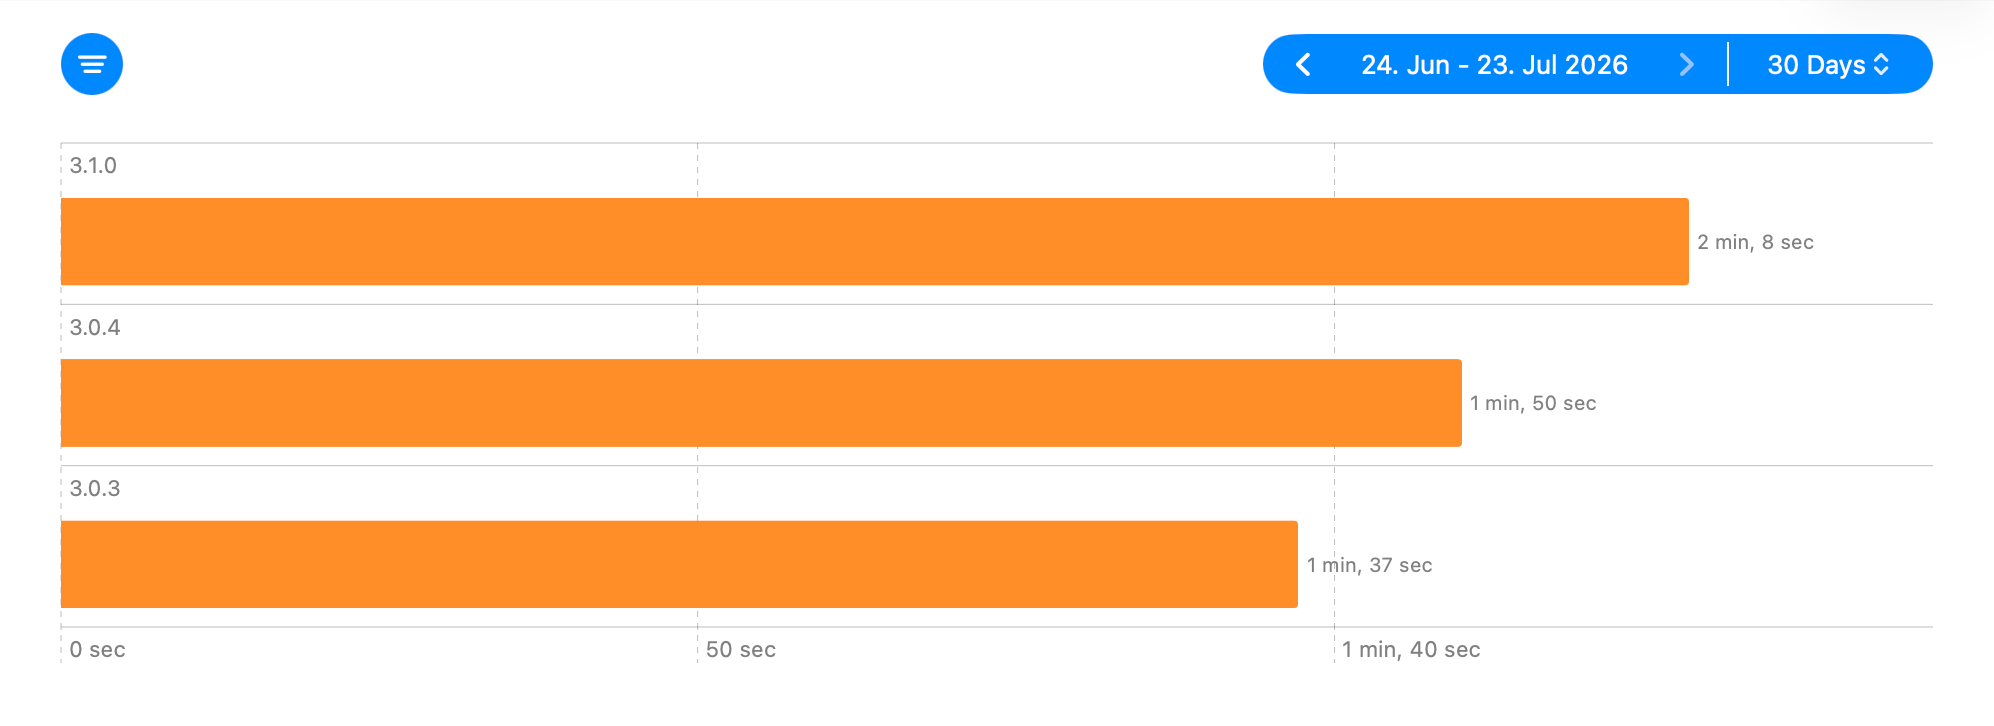
Release differences need enough time to become reliable. Wait until the new version has substantial coverage, compare equivalent periods, and check whether the gap remains after the initial rollout instead of treating the first few days as a final result.
Understand Different Device Habits
A release-wide comparison can still hide differences between device families. Use Sessions per Device by Device Type to compare how often the app is opened across the device families in your report.
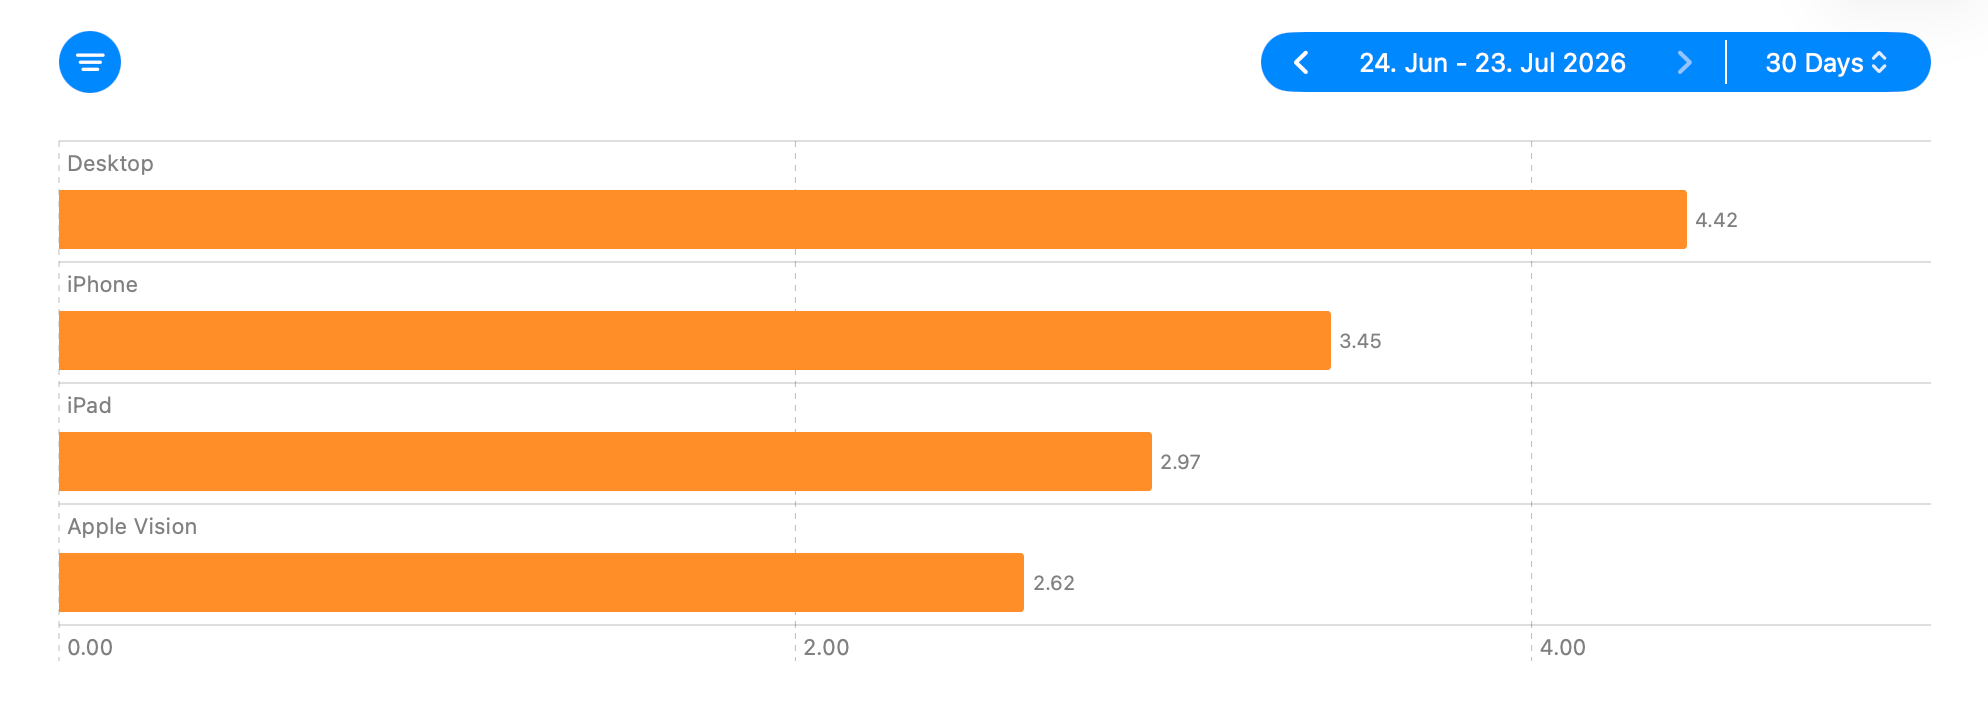
If one device family has a much higher value, users open the app more often there on days when they are active. That does not necessarily mean they also spend more time in the app, since those sessions may be shorter.
To check that, use Session Duration by Device Type to compare the average length of a session for the same device families.
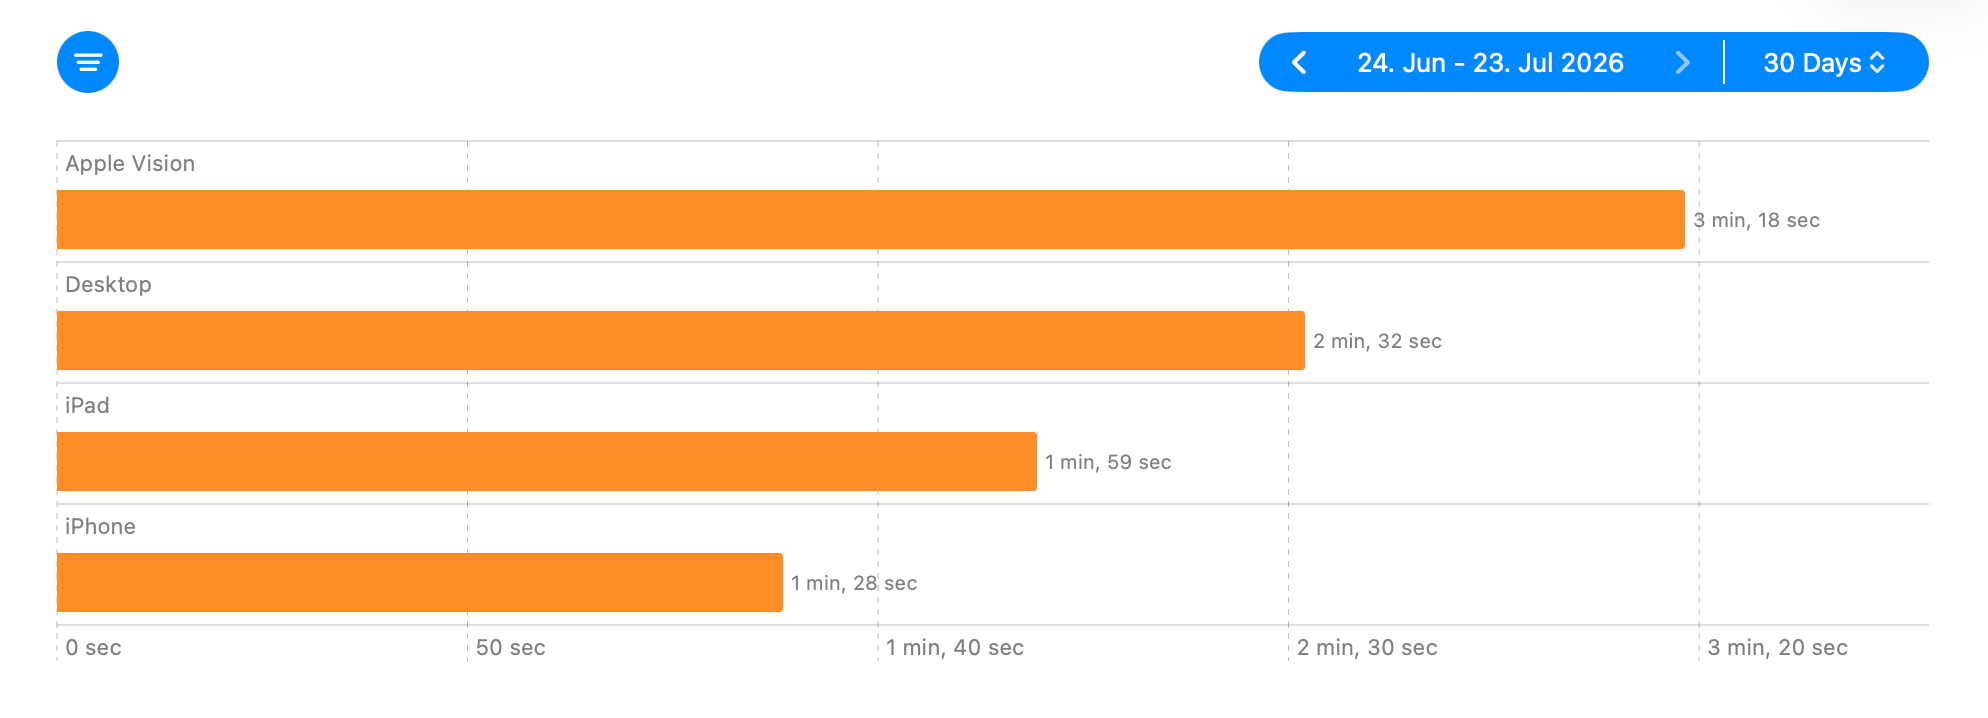
Both stats together show whether each device family is used for short and frequent visits or for fewer, longer sessions. Frequent short sessions may fit quick checks, while fewer long sessions may fit more focused work. Which pattern is better depends on what users are expected to do on each device.
Compare the Sources Behind Engagement
If neither the release nor the device family explains the change, discovery source is worth checking. Devices by Source shows which sources account for the most daily device activity.
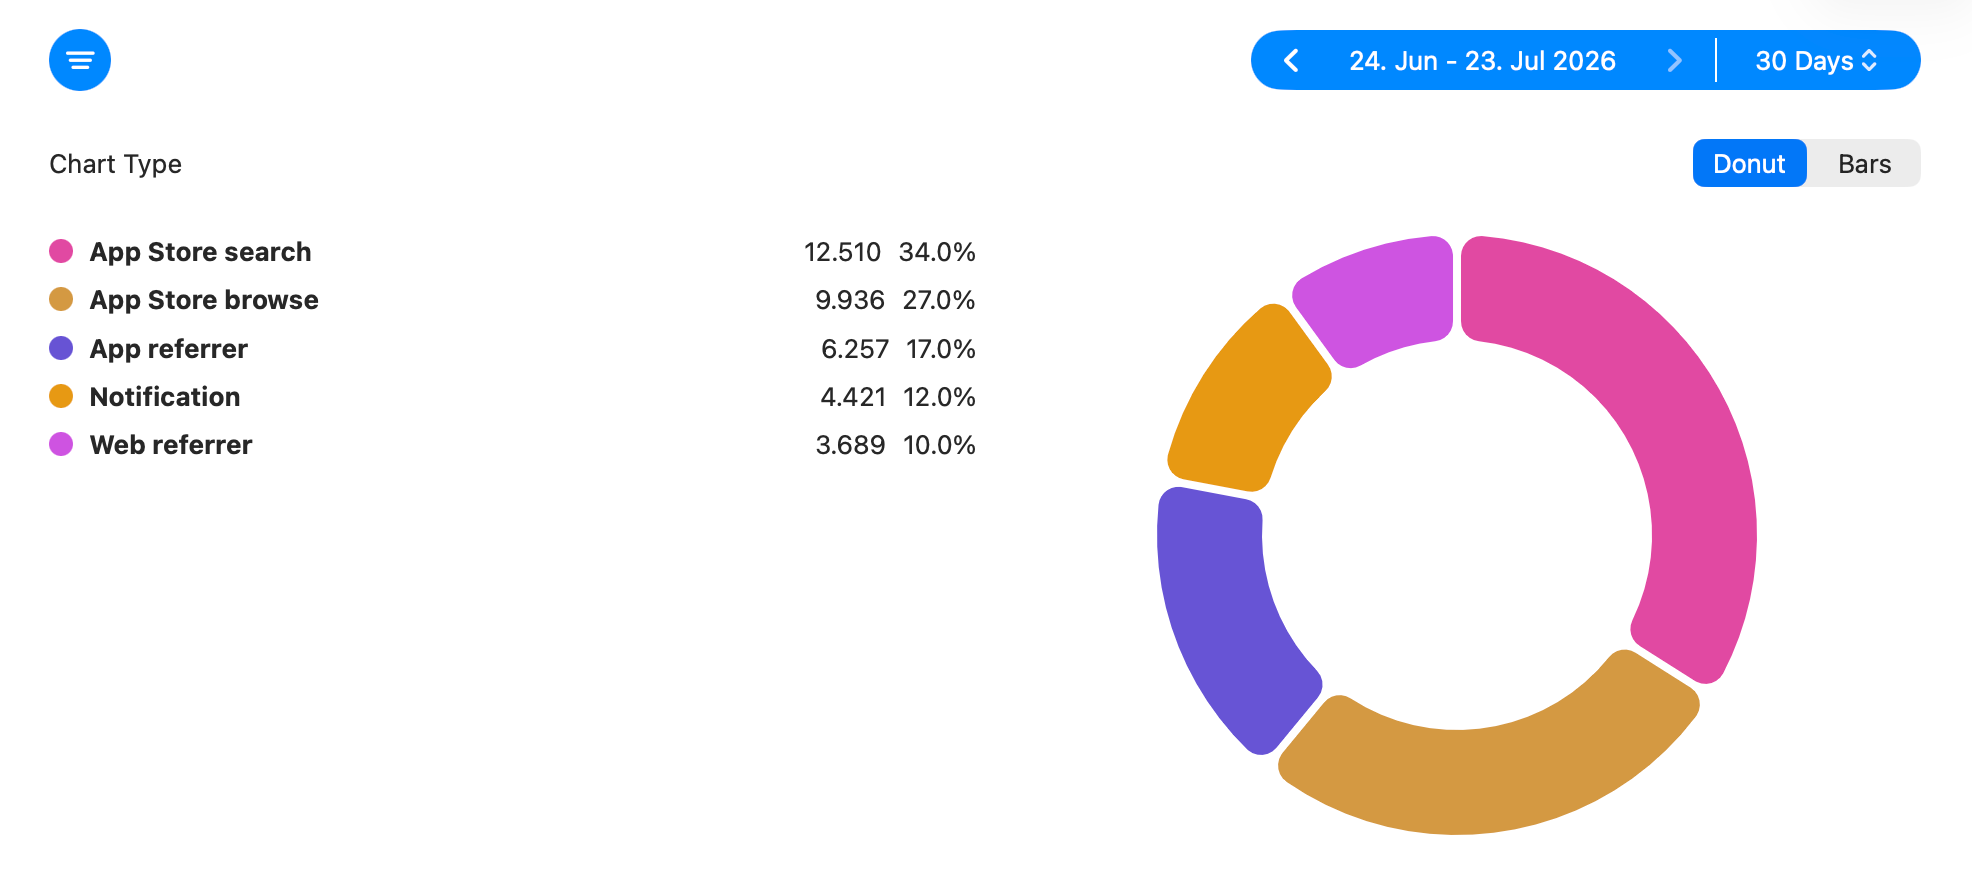
This tells us how much daily device activity is associated with each source before we compare how those devices use the app. A source with many active device-days affects the overall result more than a source with little activity, but it does not tell us how often those devices open the app.
Device activity alone does not tell us how often those devices open the app. Use Sessions per Device by Source to add that comparison.
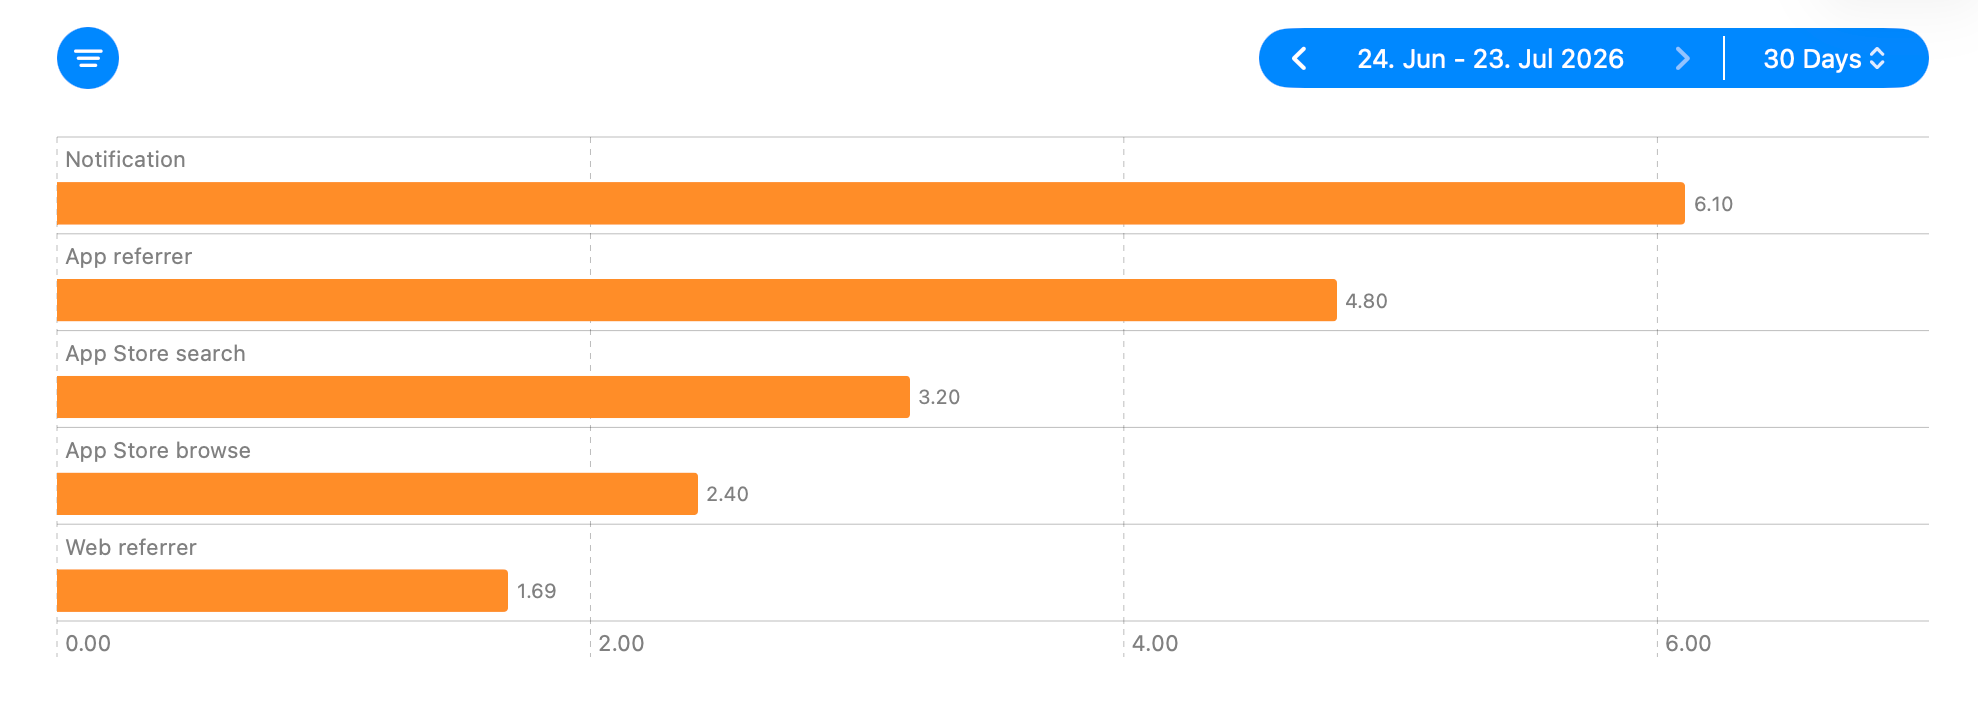
It shows how often devices associated with each source open the app on an average active day. A higher value means more openings on days when those devices are active. Check Devices by Source before drawing a conclusion, since a small source can produce an unusual average from relatively little activity.
Frequent opening still does not tell us how much time users spend in each visit. Session Duration by Source compares the average length of a session for each source.
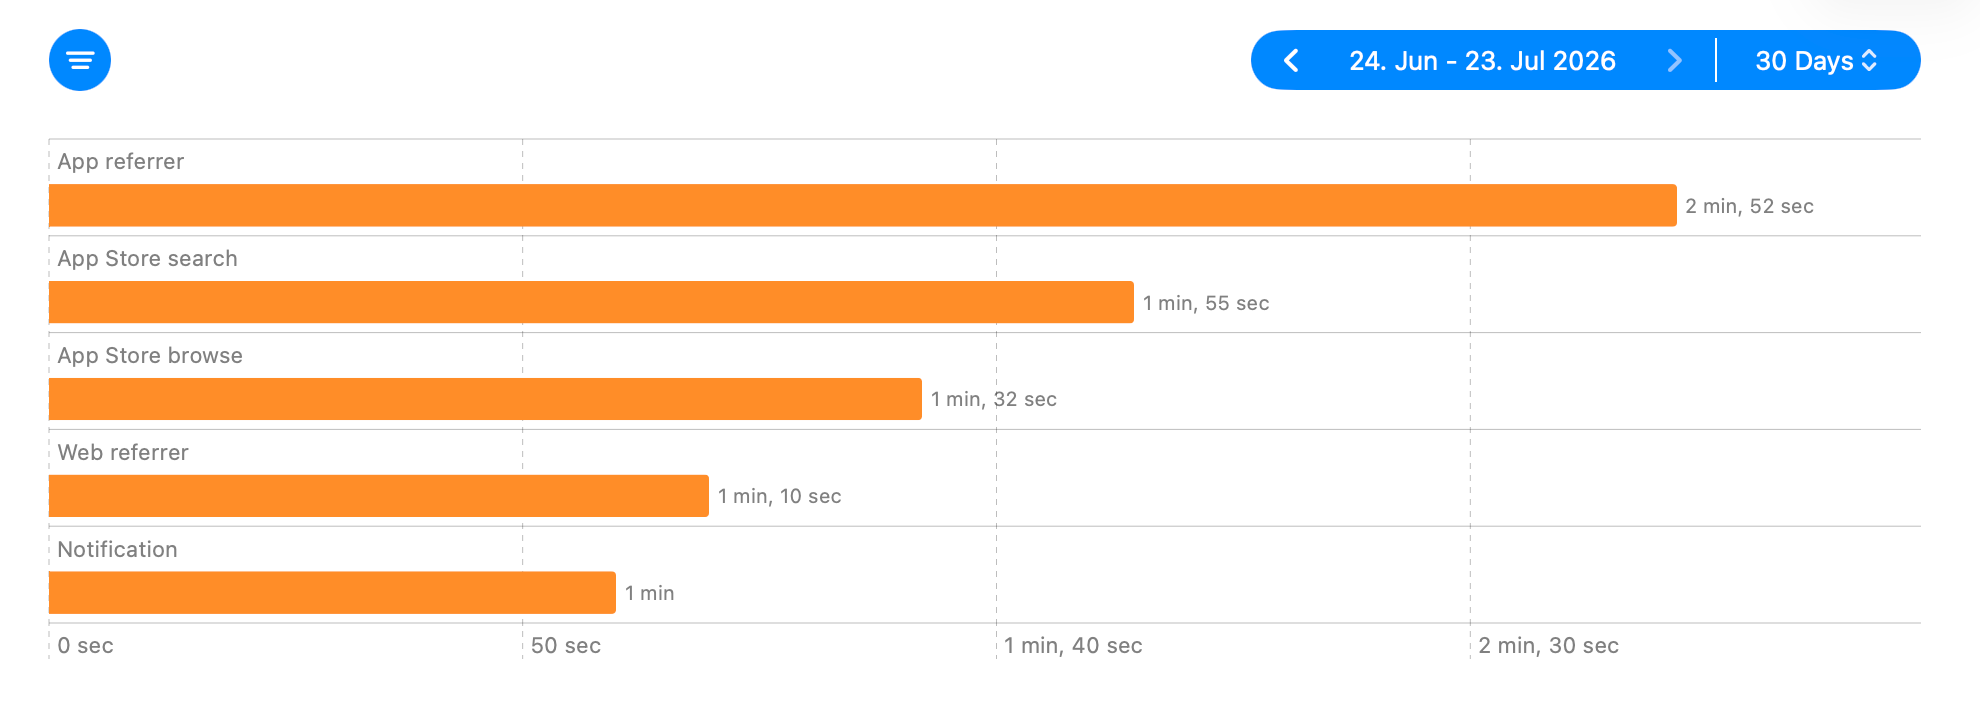
If one source ranks high in both charts, it may be acquiring users who later open the app more often and stay longer. If it ranks low in both, users from that source may open the app less often and spend less time in each session. Together, these stats show which discovery sources appear to bring users who use the app most actively after downloading it.
Keep the Data Boundaries in Mind
These comparisons are directional rather than a census of every customer. Apple’s App Sessions report is based on users who agreed to share analytics, applies privacy protections, and may take up to five days to become complete. Prioritize sustained trends and meaningful differences instead of treating small gaps or the latest days as exact.
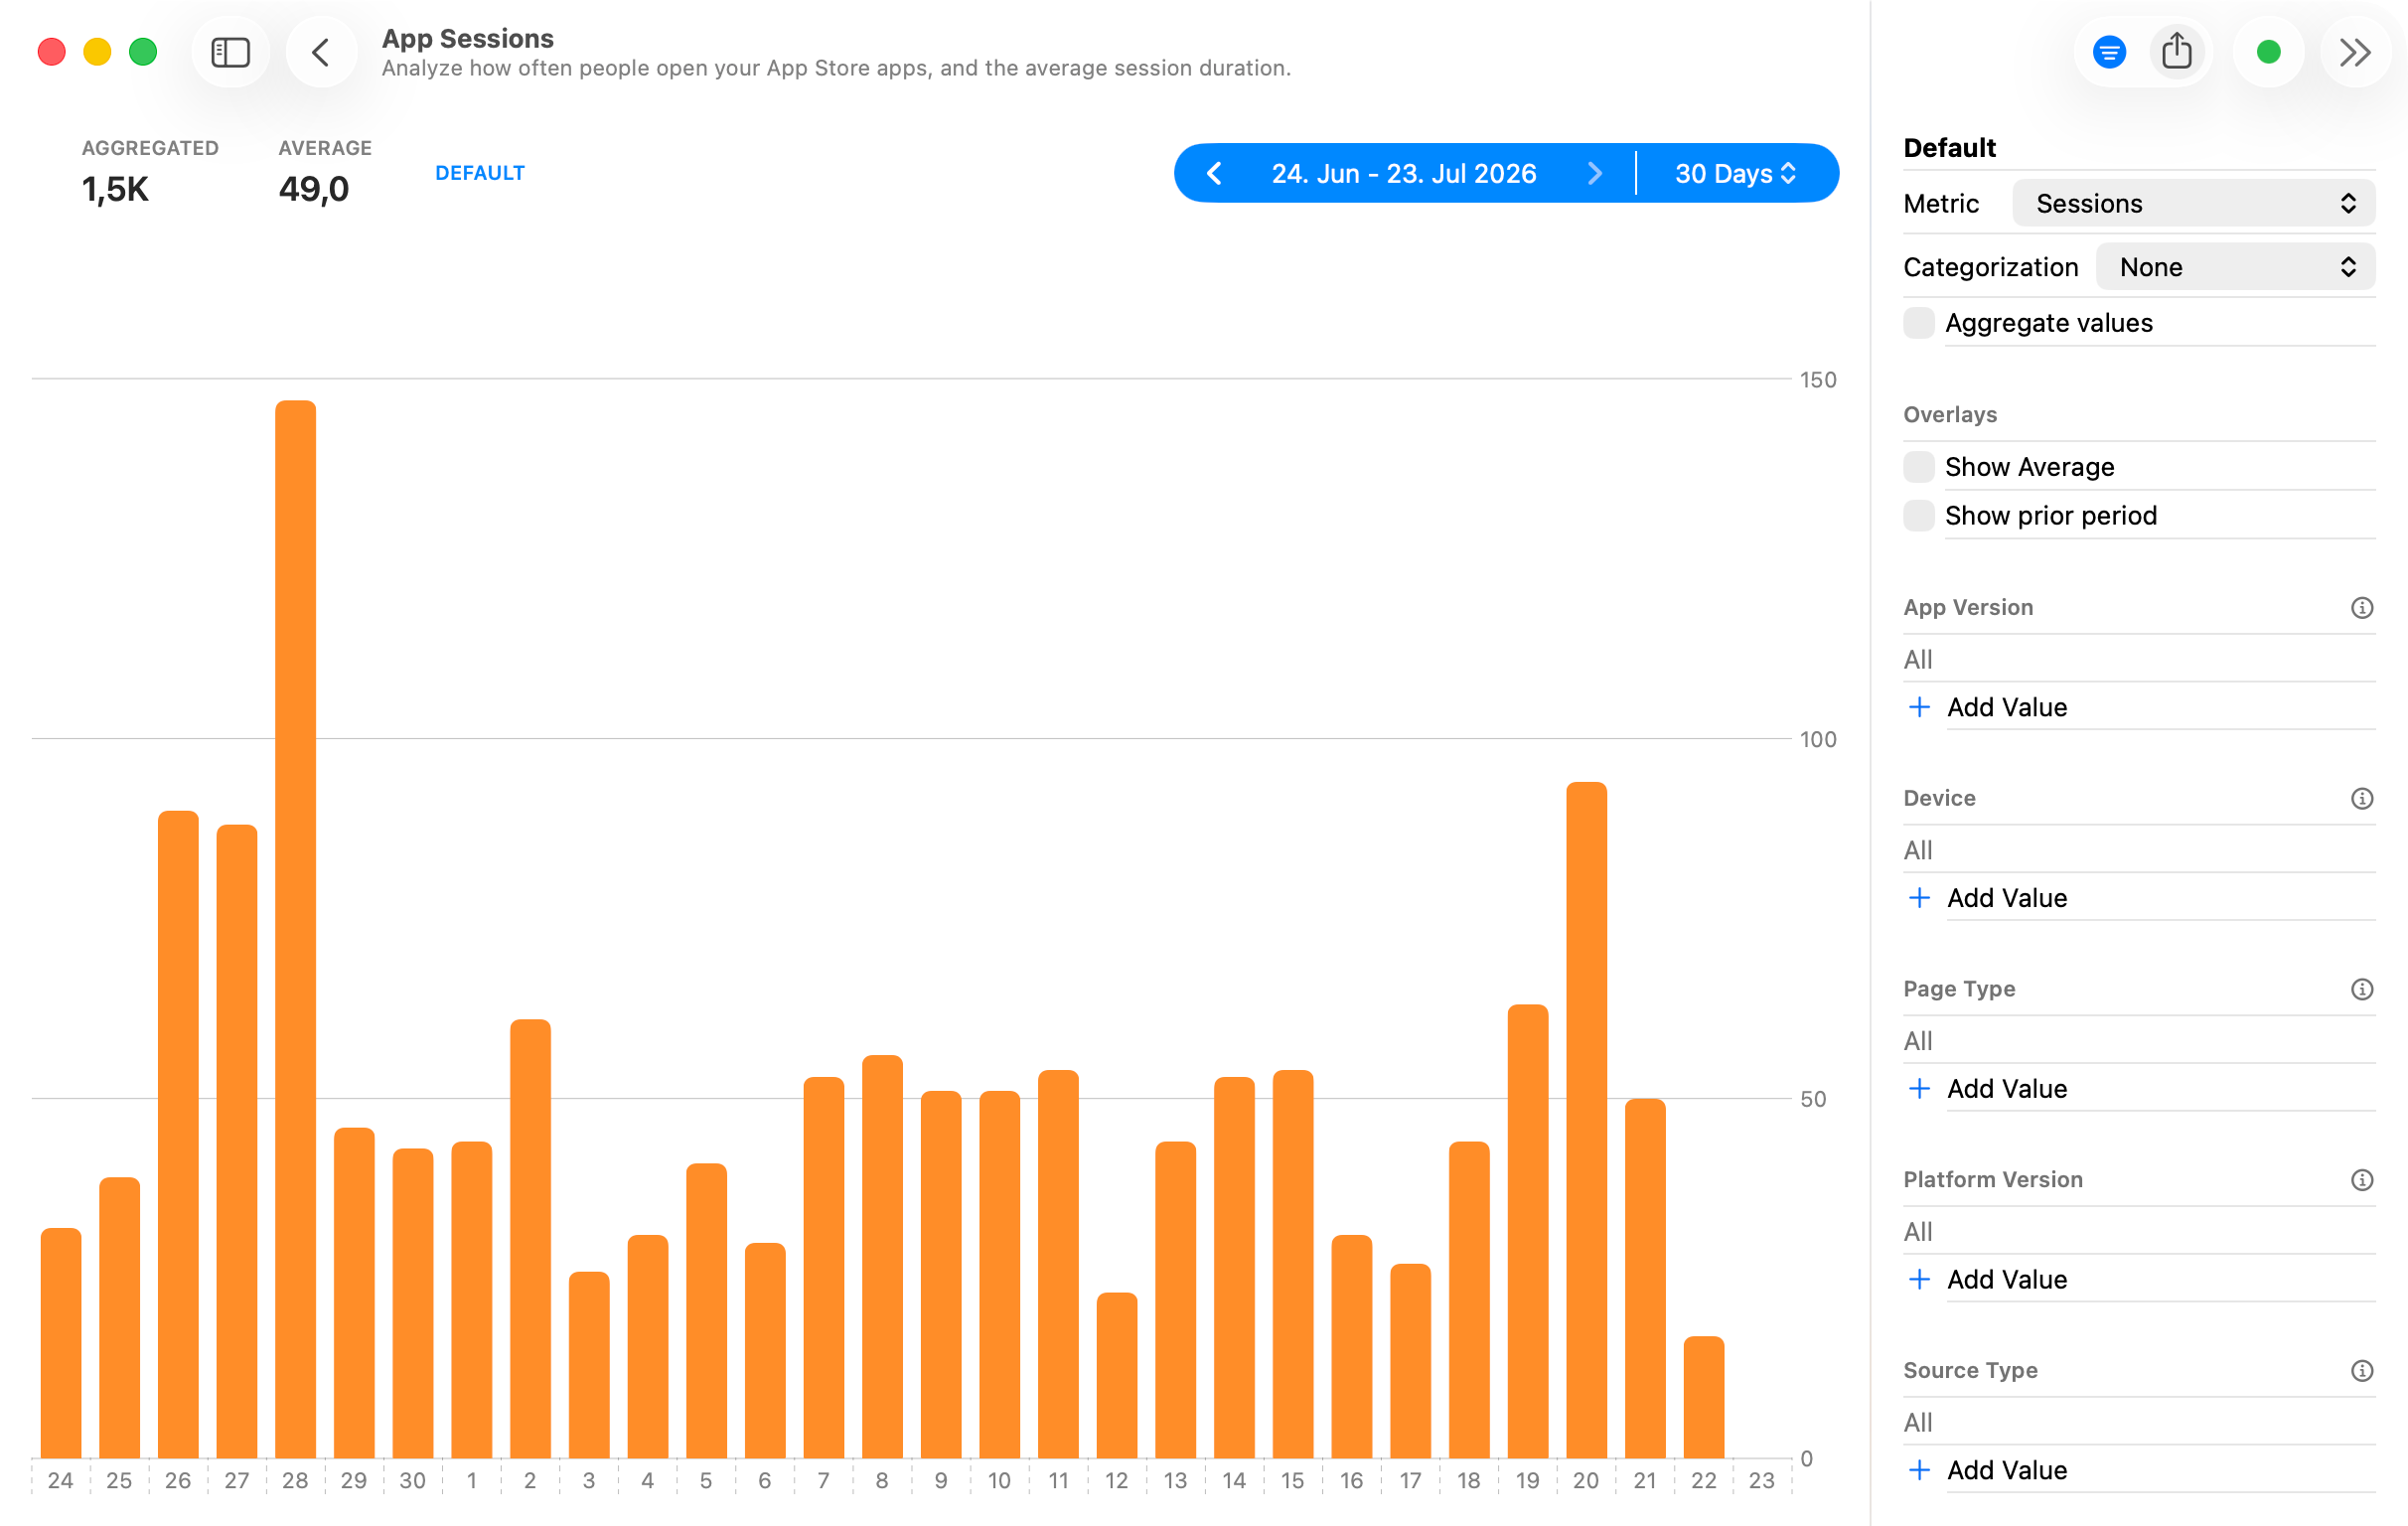
When a stat reveals an unexpected difference, the raw data helps you check what is behind it. Open the App Sessions data in Explore and combine filters with the available categorizations. You can, for example, filter to one Source Type and split the result by Device or App Version to see whether the same difference remains. Save the configuration as a custom preset if you want to repeat the comparison later.
Wrap Up
A useful App Sessions analysis moves from one specific comparison to another. Start with the familiar Sessions per Active Device trend, add visit length and daily reach, then check whether releases, device habits, or discovery sources explain the difference. This turns a single engagement number into a much clearer picture of how people actually use your app.
If you have any more questions or ideas, don't hesitate to contact me via the form in the sidebar. Happy wizarding!