
Understand What Drives Your App Store Proceeds
The usual revenue check is simple: open App Store Connect and look at proceeds. That tells you whether your app earned more or less than before, but it does not explain why. Did a specific product grow? Did the mix of acquisition sources change? Or did refunds reduce an otherwise good period?
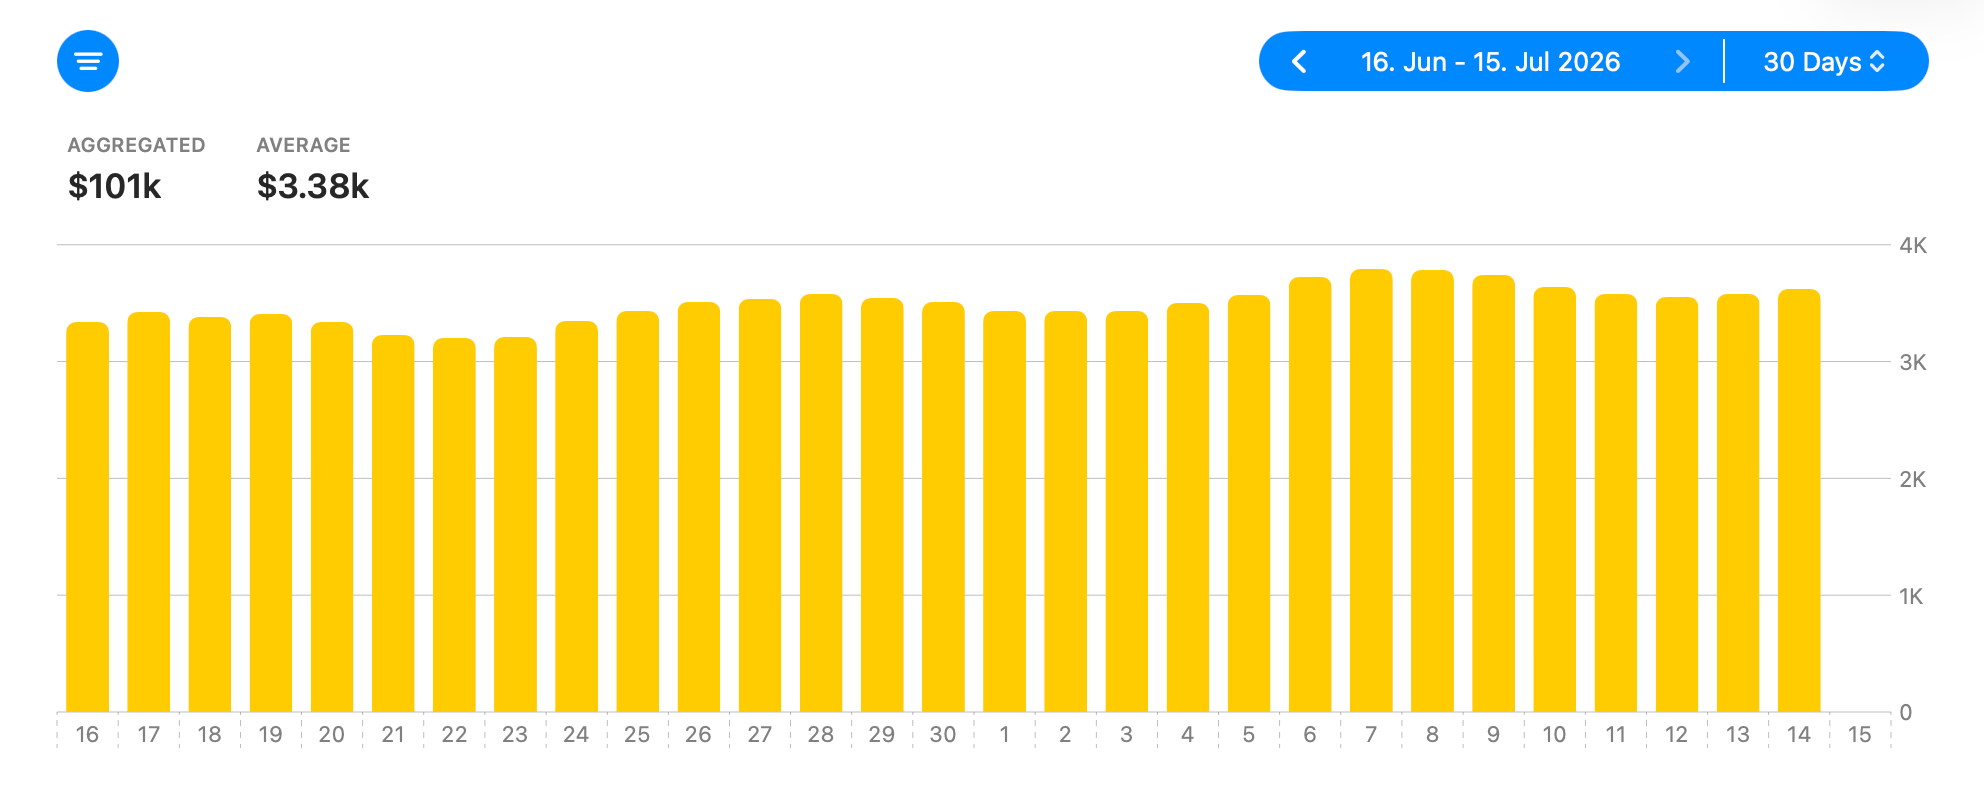
That familiar Total Proceeds stat is our starting point in ConnectWizard, not the end of the analysis. The App Store Purchases report type becomes much more useful once we break that total down. In this guide, we first find the products responsible for the result, then inspect where the associated customers came from, and finally measure how much refunds reduced our earnings.
Products
When Total Proceeds changes, the first question is which products caused the difference. Use Proceeds by Content to see how much each app or in-app purchase contributed.
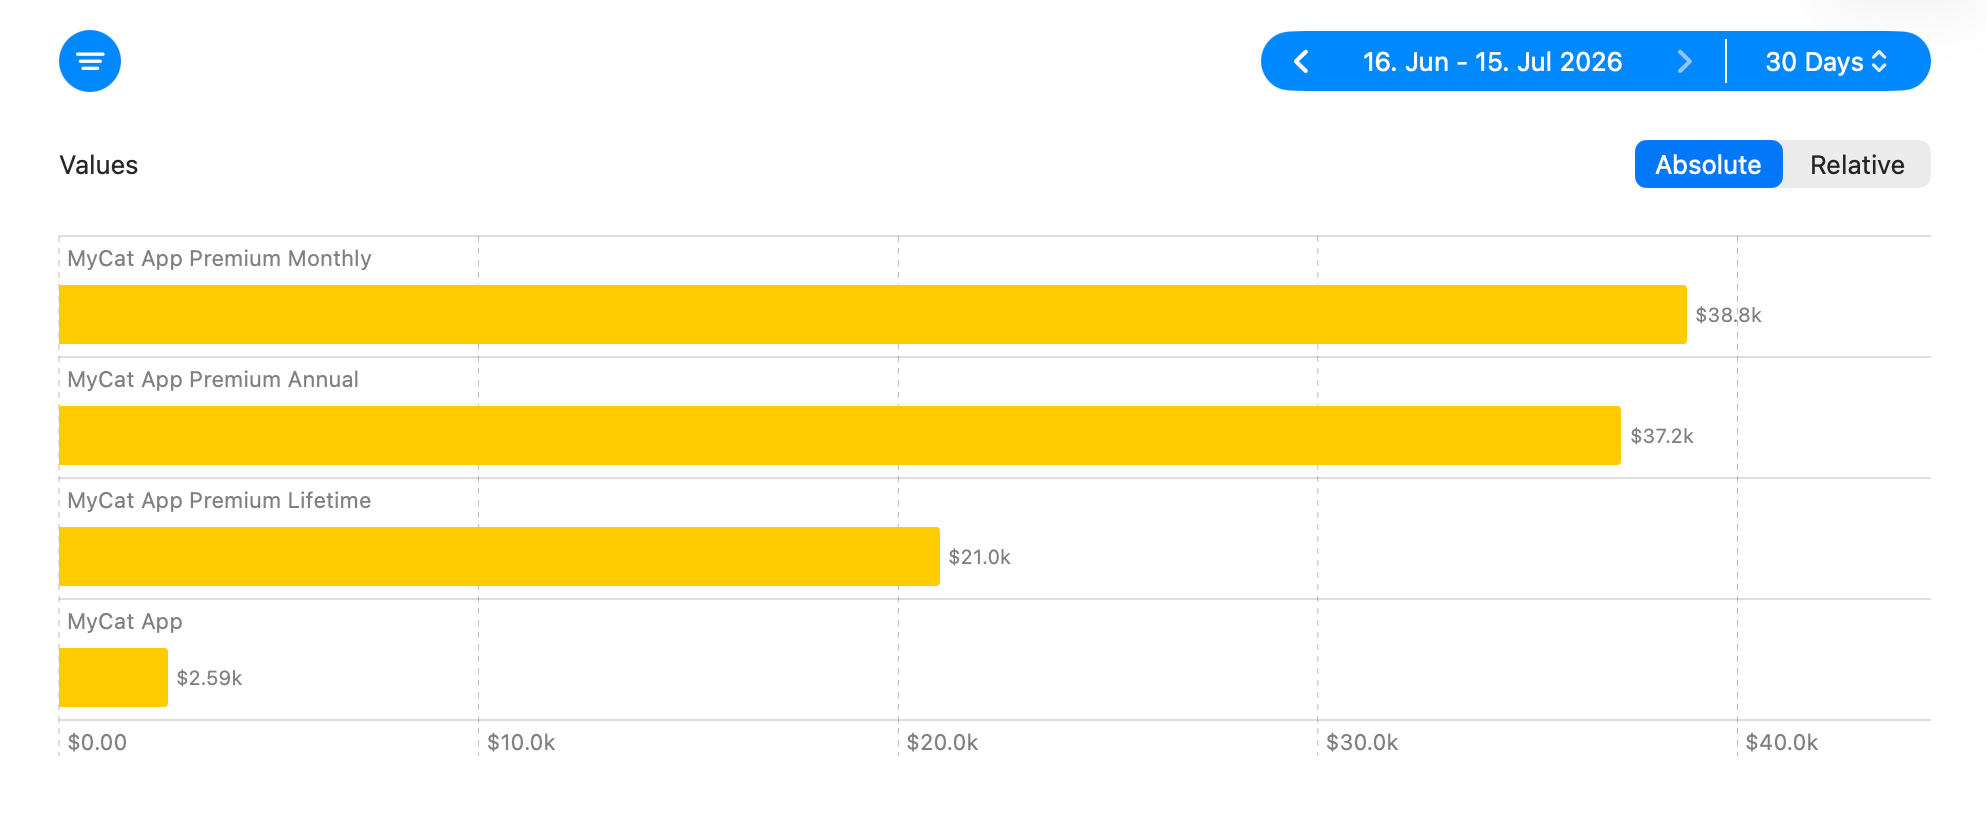
A product at the top of this chart may be there because customers buy it frequently or because each purchase generates high proceeds. Proceeds per Purchase by Content helps distinguish between the two. Comparing both stats tells you whether a product contributes through volume, value per purchase, or both.
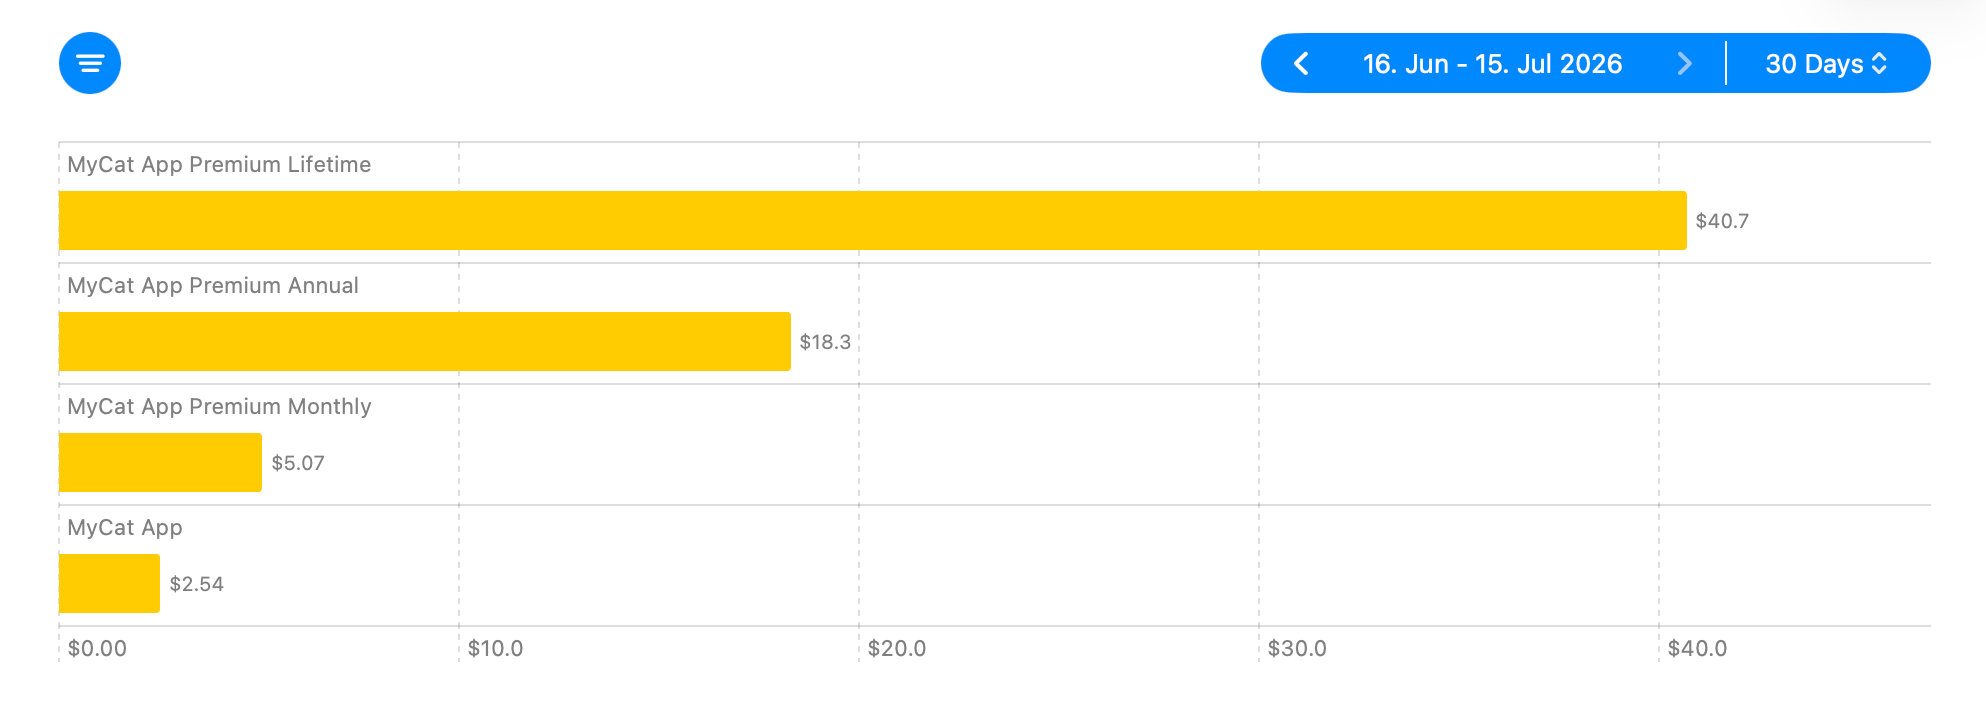
The per-purchase result is not the same as the listed price. Territory-specific pricing, taxes, Apple’s commission, and refunds all affect the proceeds reported for a purchase. This makes the stat useful for comparing the actual outcome of your products across the same period.
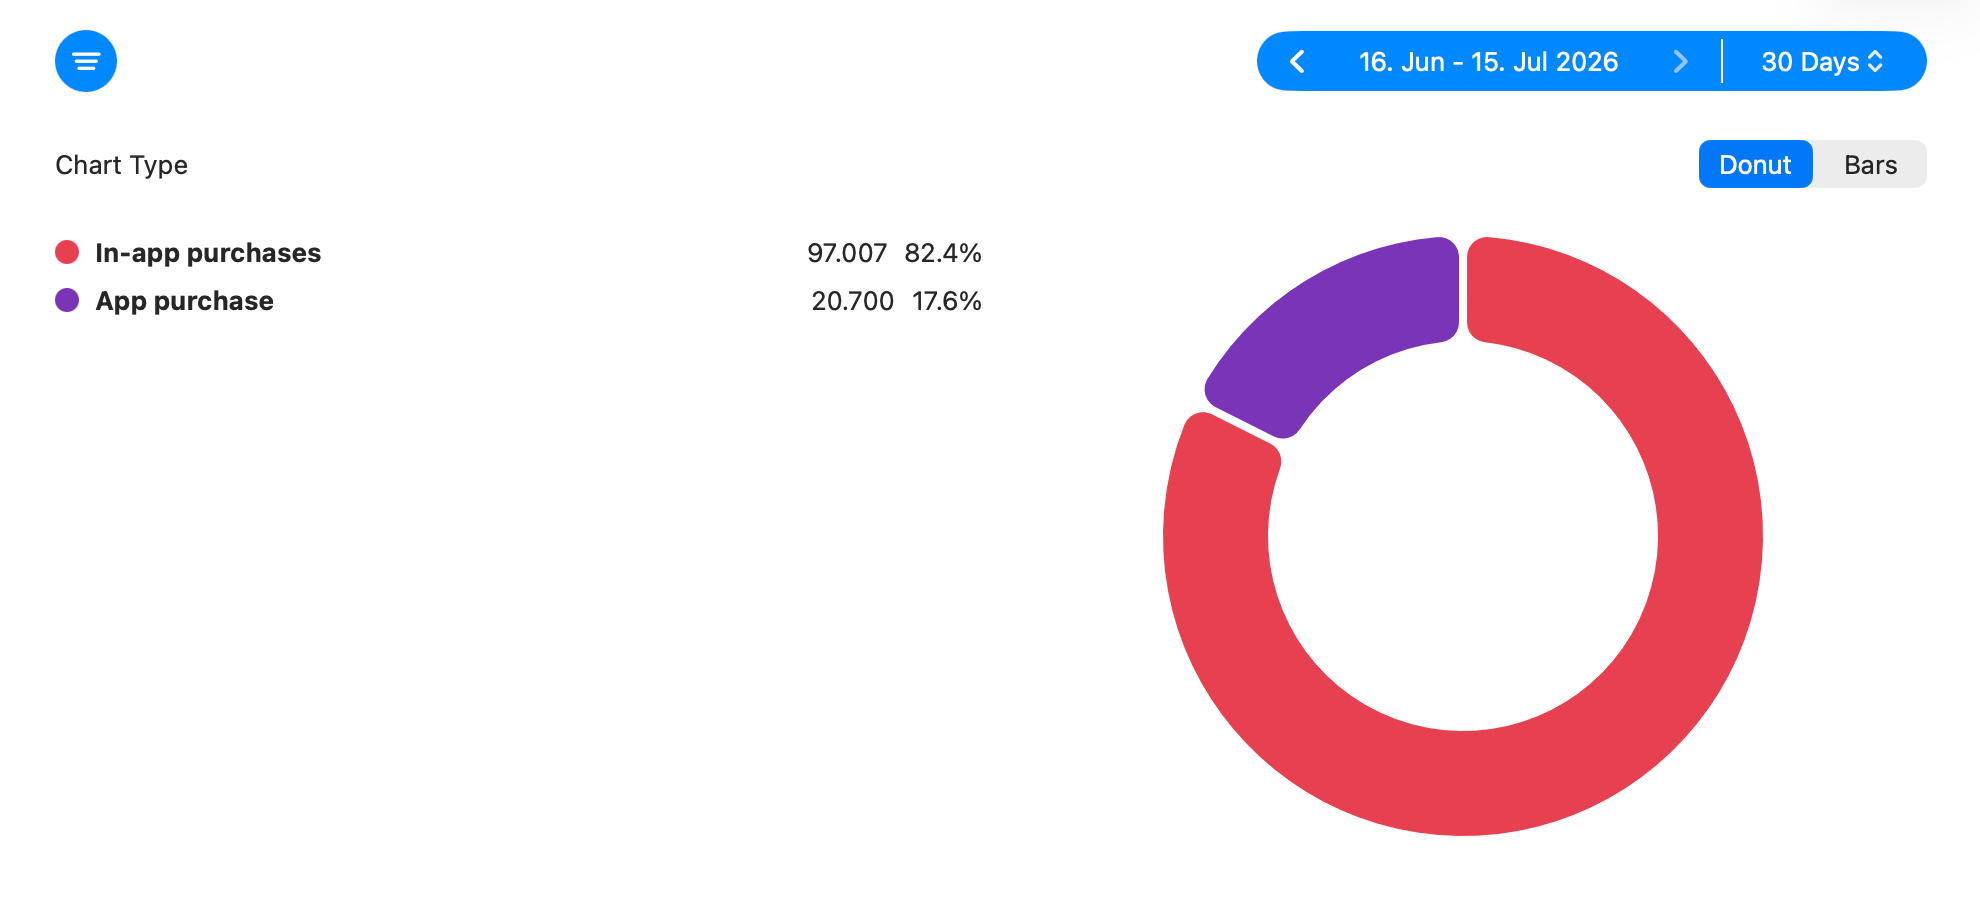
Before comparing individual products, it can help to identify which purchase model contributes more. Proceeds by Purchase Type provides this broader split between paid app purchases and in-app purchases.
Sources
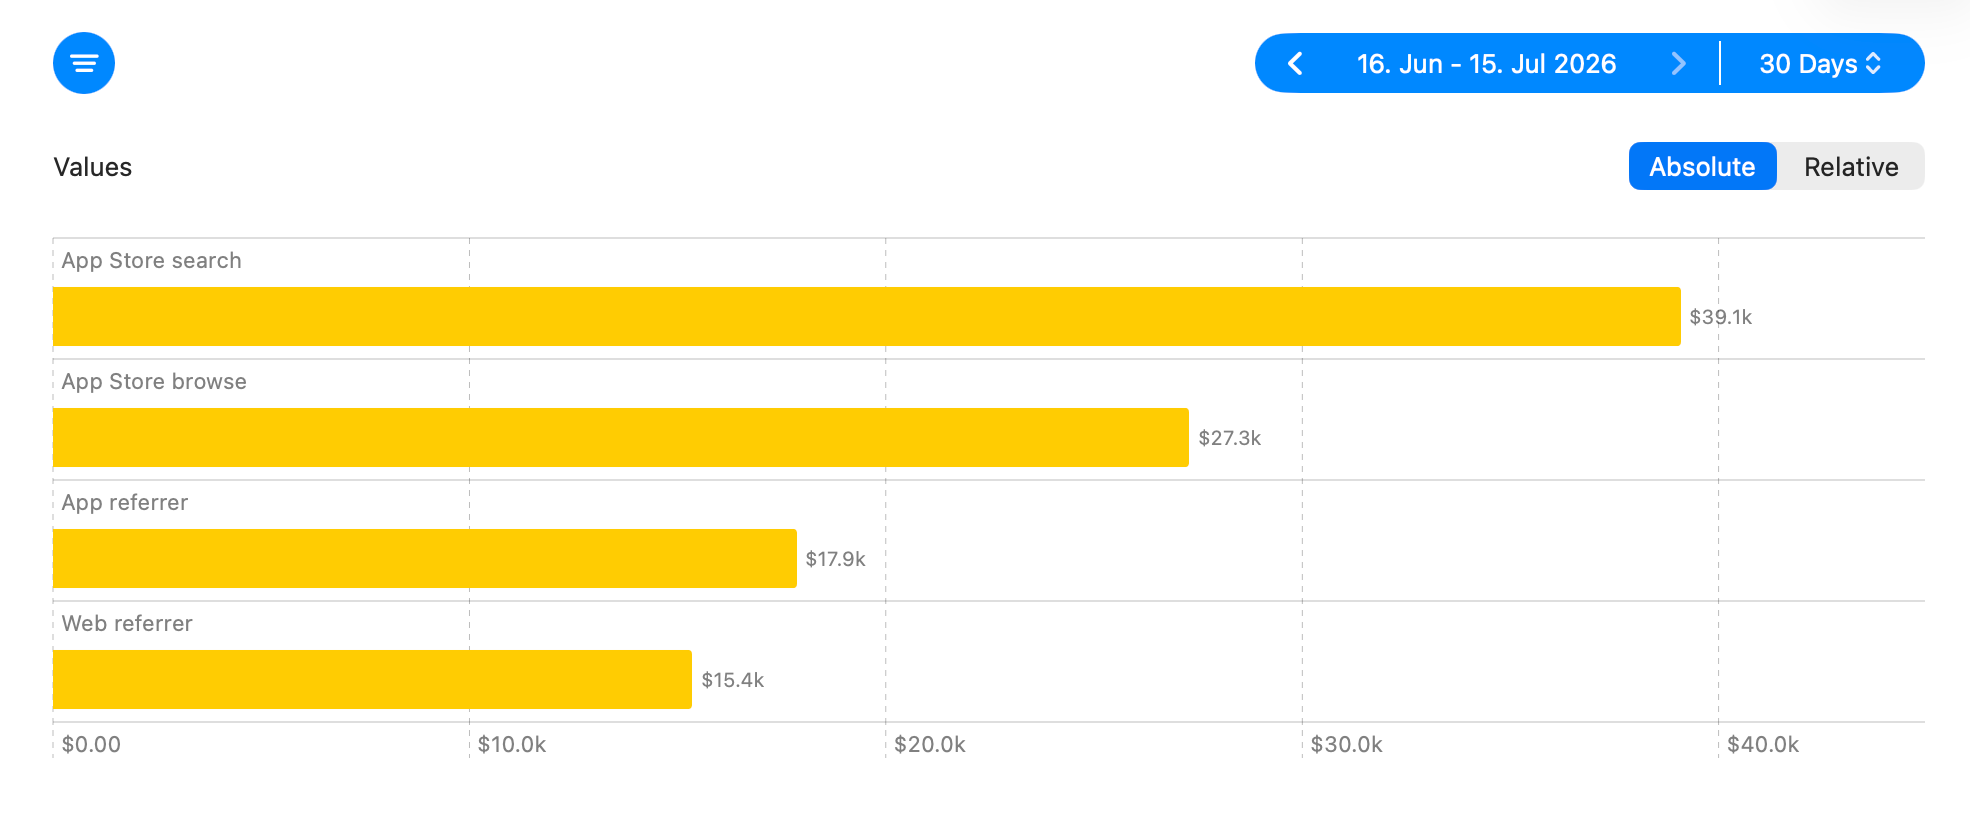
Once you know which products generate your proceeds, the next question is where the associated customers discovered your app. Use Proceeds by Source to compare how much each source contributes to your earnings.
The largest source is not always the source with the most valuable purchases. Proceeds per Purchase by Source lets you compare them independently of their total proceeds. App Store search may generate more money overall, while a web referrer generates more proceeds each time a customer makes a purchase.
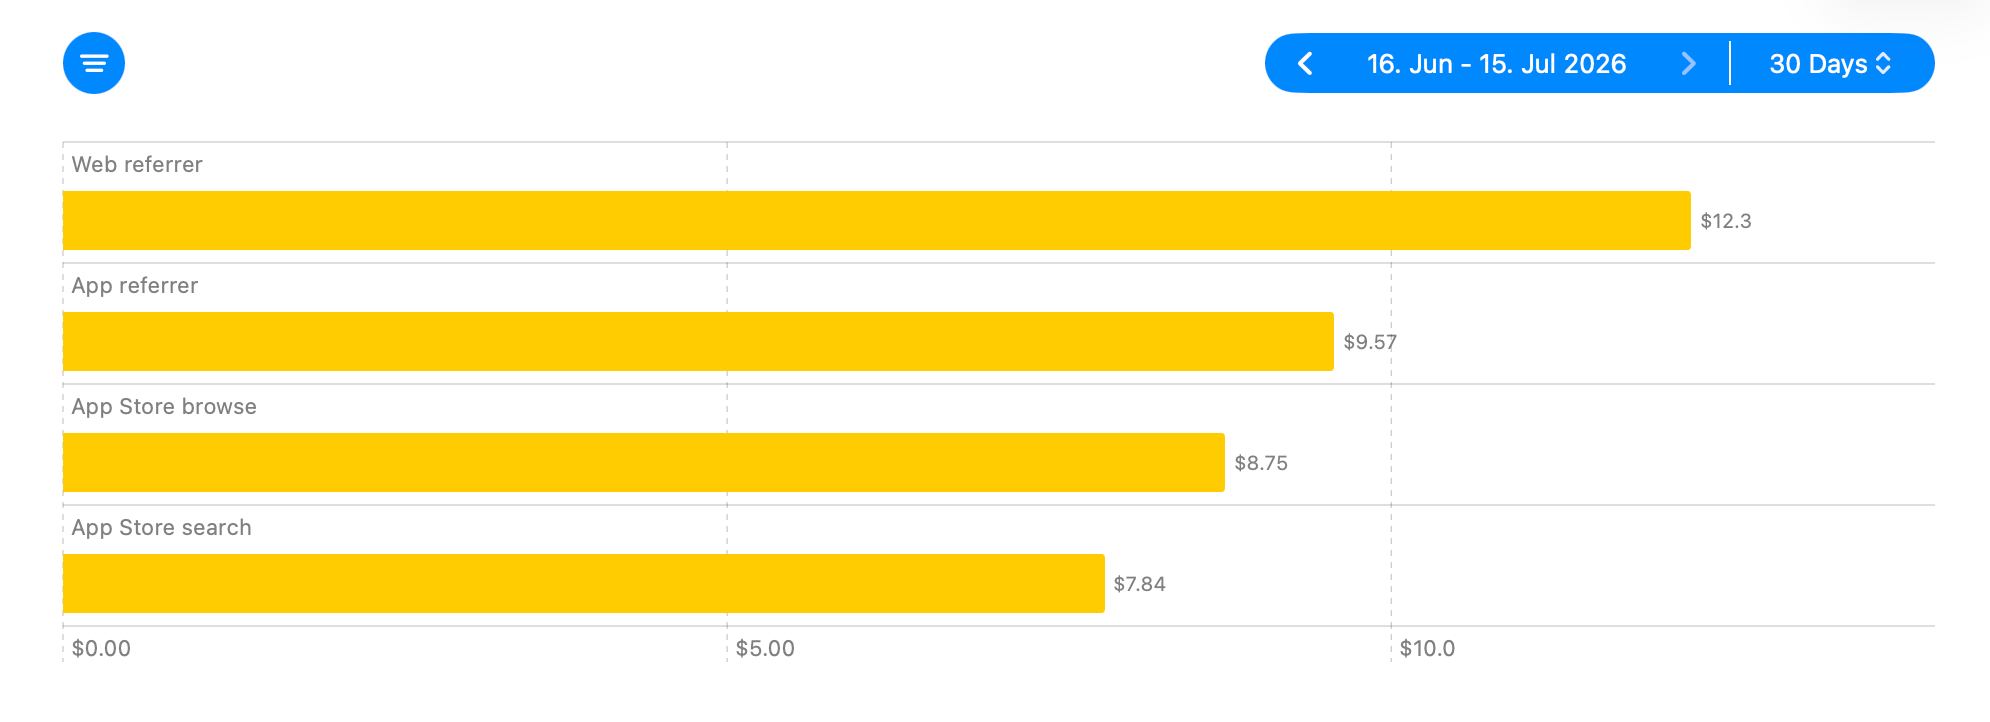
A source with modest proceeds per purchase can still contribute the most money by generating more purchases. Use Purchases by Source as supporting context when you need to confirm whether volume explains the difference.
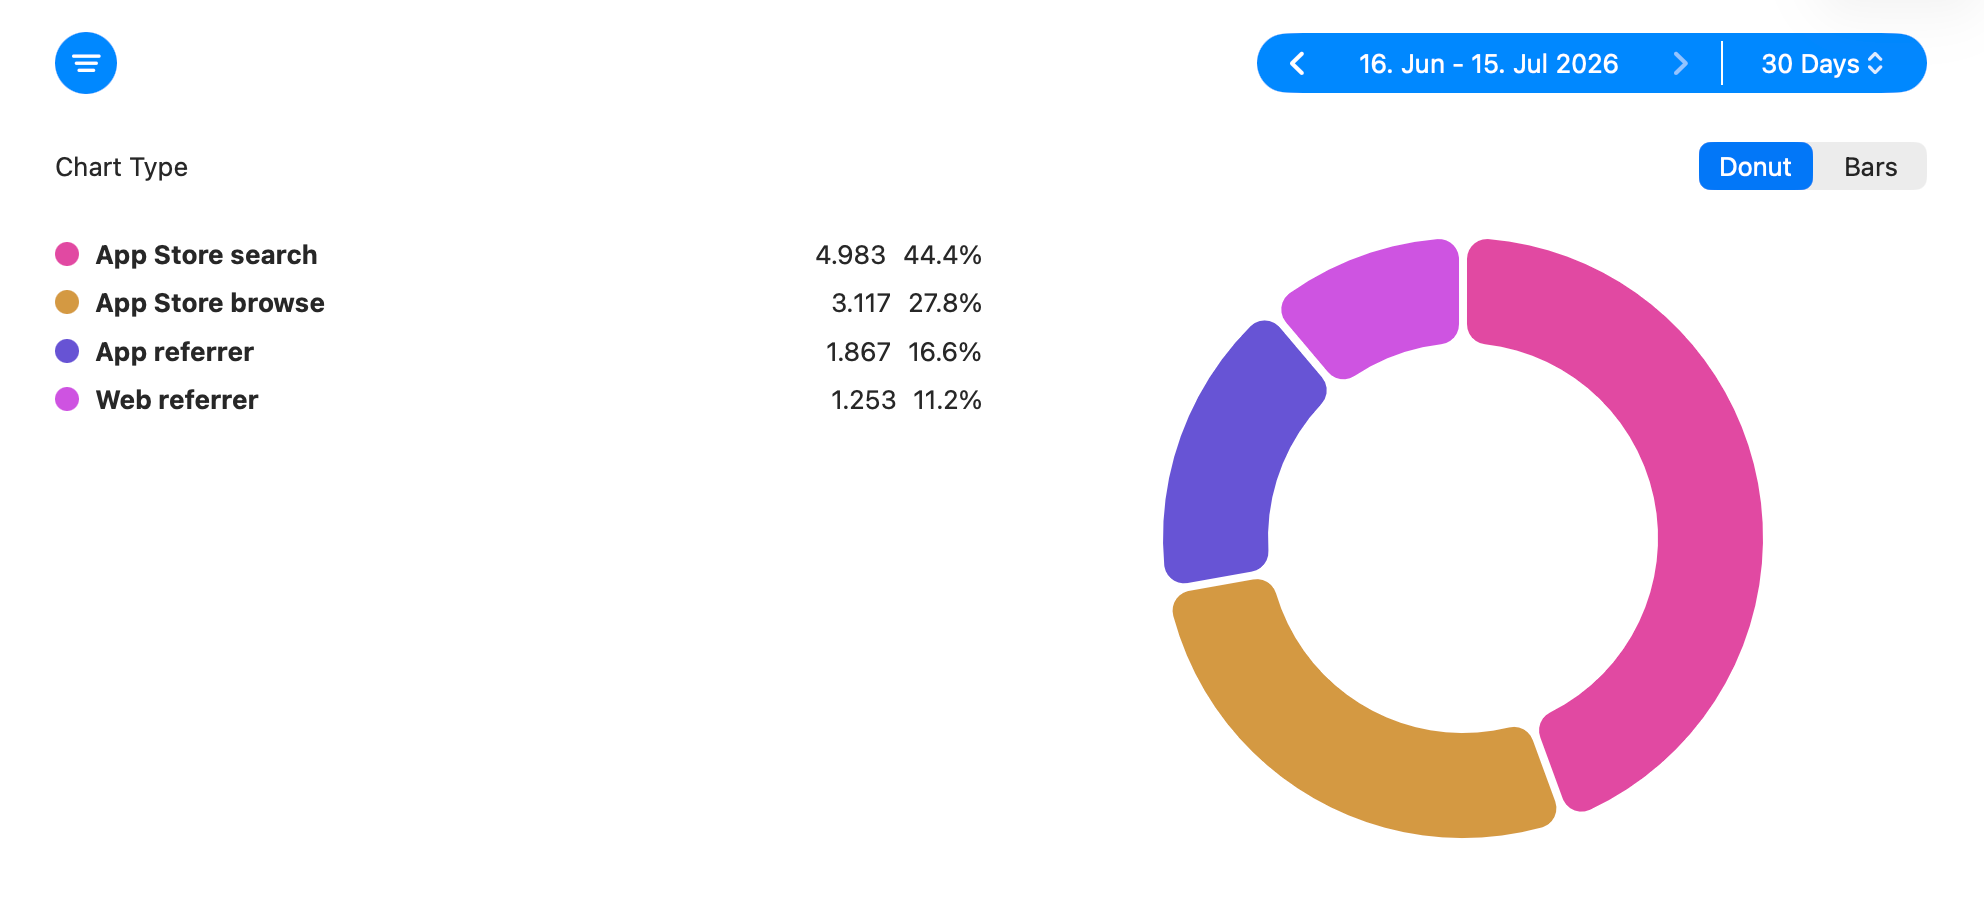
Keep in mind that Source Type is not a complete advertising attribution system. It reflects the discovery source Apple reports for the purchase data. Use it to compare the available sources, not individual campaign performance.
Refunds
After identifying where your proceeds came from, a quick refund check should confirm that only a small share was returned to customers. Total Proceeds already includes negative proceeds, so the net value alone can hide this activity.
The goal is simple: refund rates should stay very low and stable. Refunded Proceeds shows the amount lost to complete and partial refunds, while the Proceeds Refund Rate compares it with positive proceeds. The amount may increase as revenue grows, but the rate should remain low.
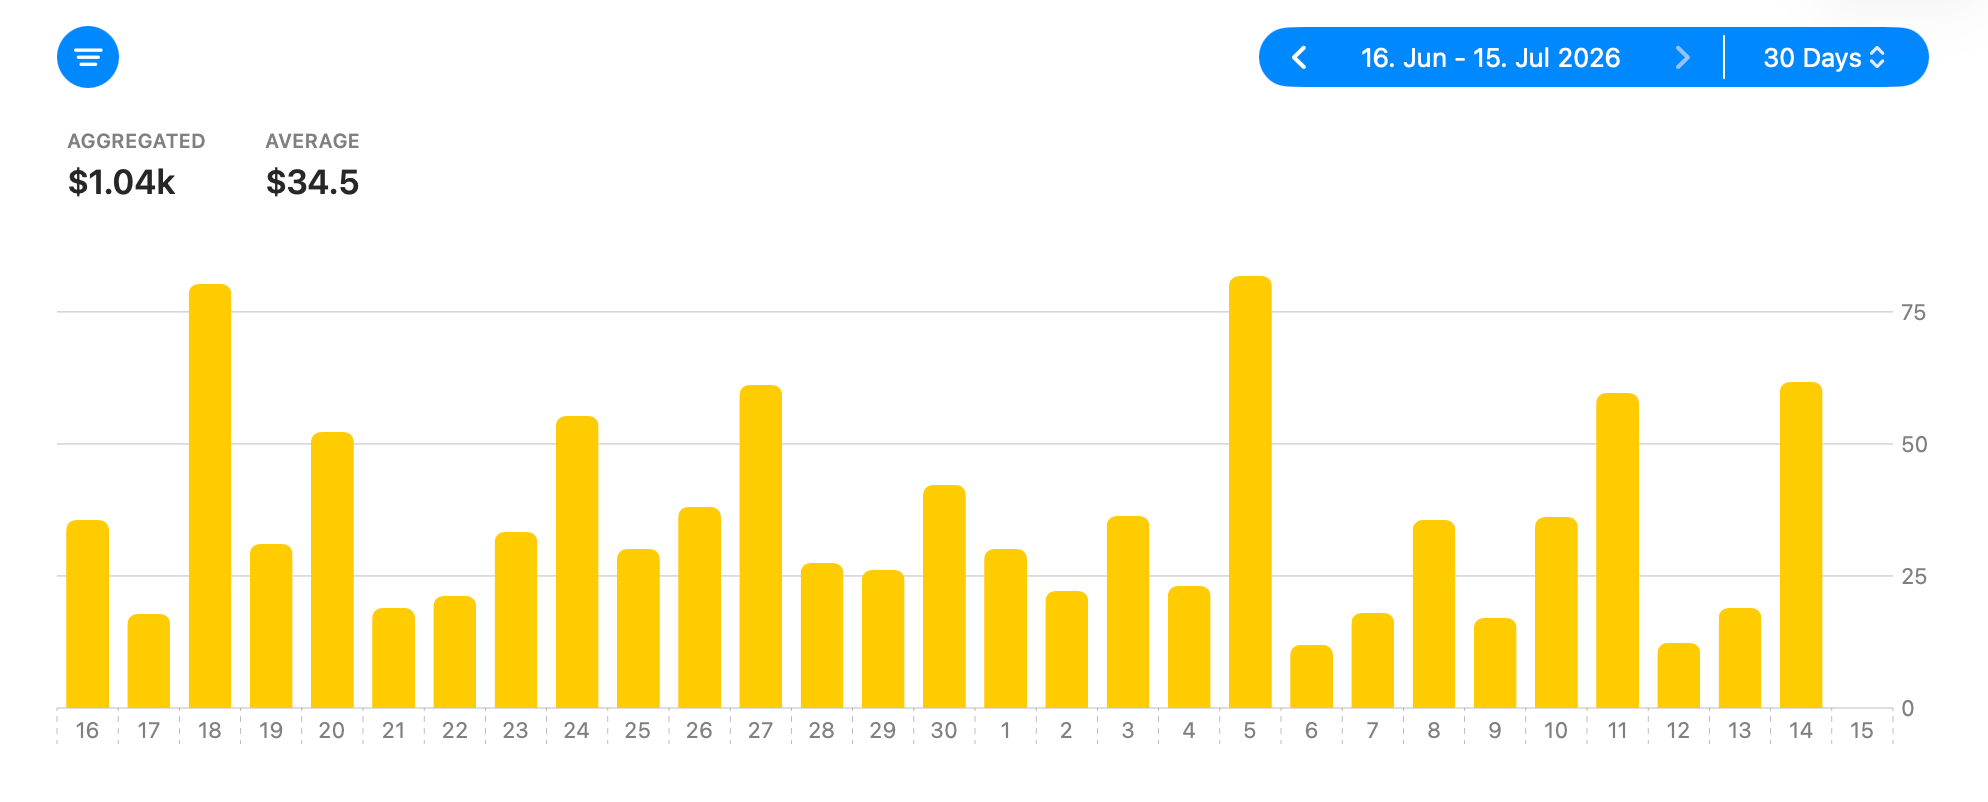
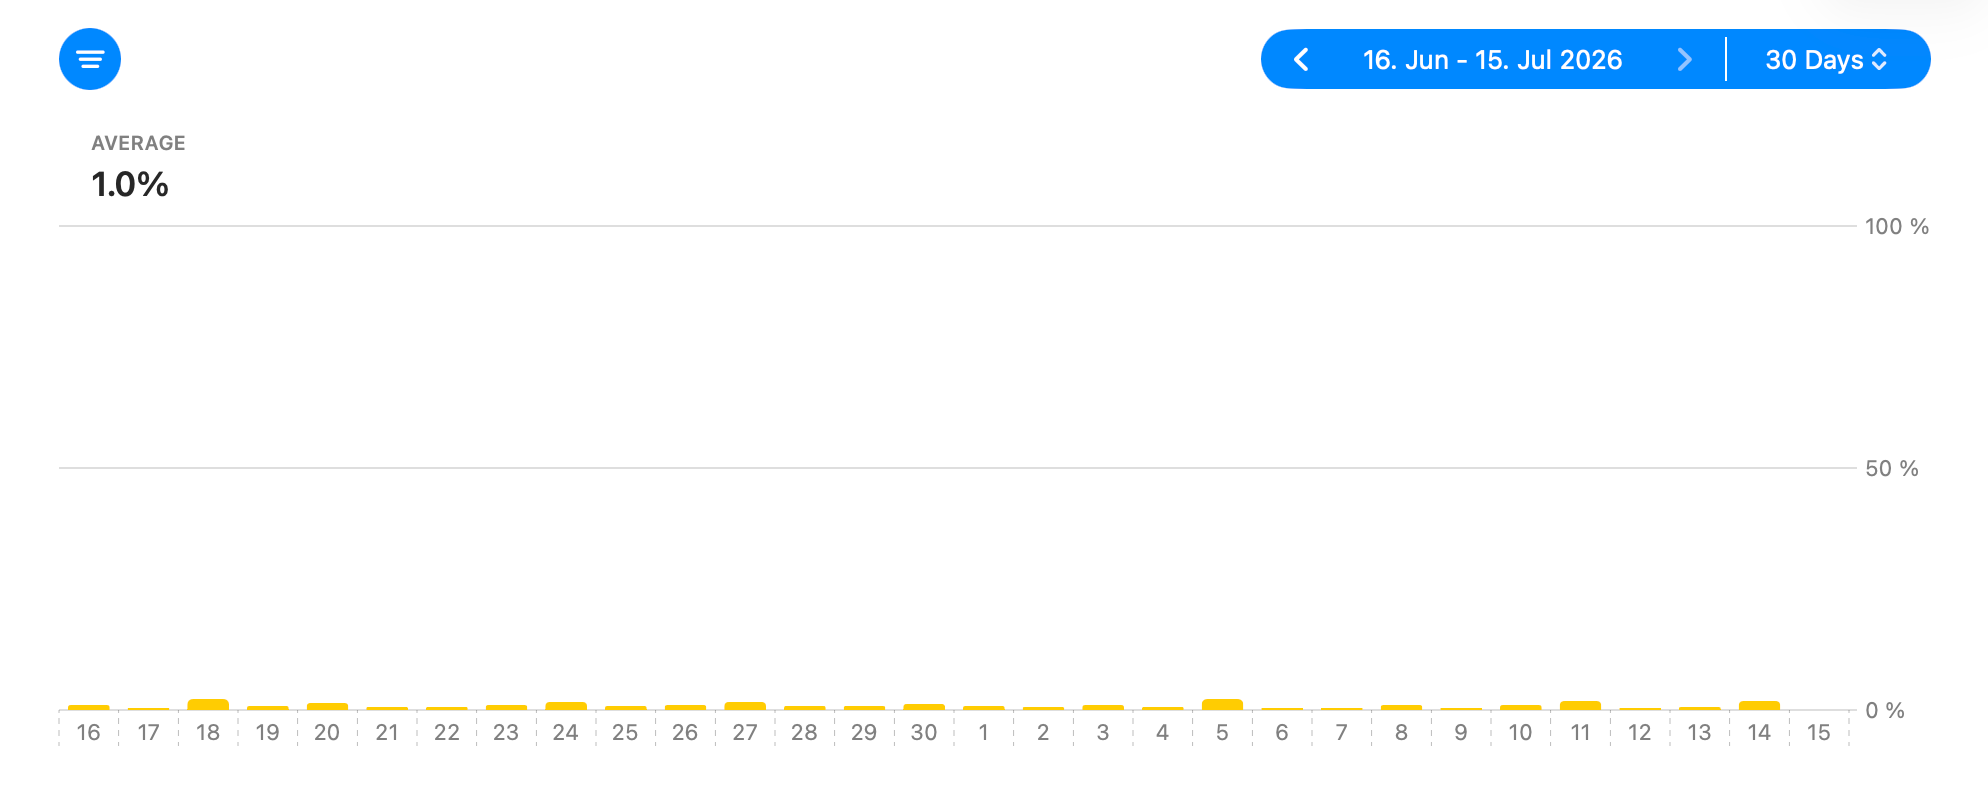
If the rate rises, the next question is whether the problem is tied to a specific product or discovery source. Purchase Refund Rate by Content compares the frequency of complete refunds across products, while Purchase Refund Rate by Source provides the same comparison across discovery sources. Both divide fully refunded purchases by positive purchases within each category, so large products or sources do not rank highly simply because they generate more purchases.
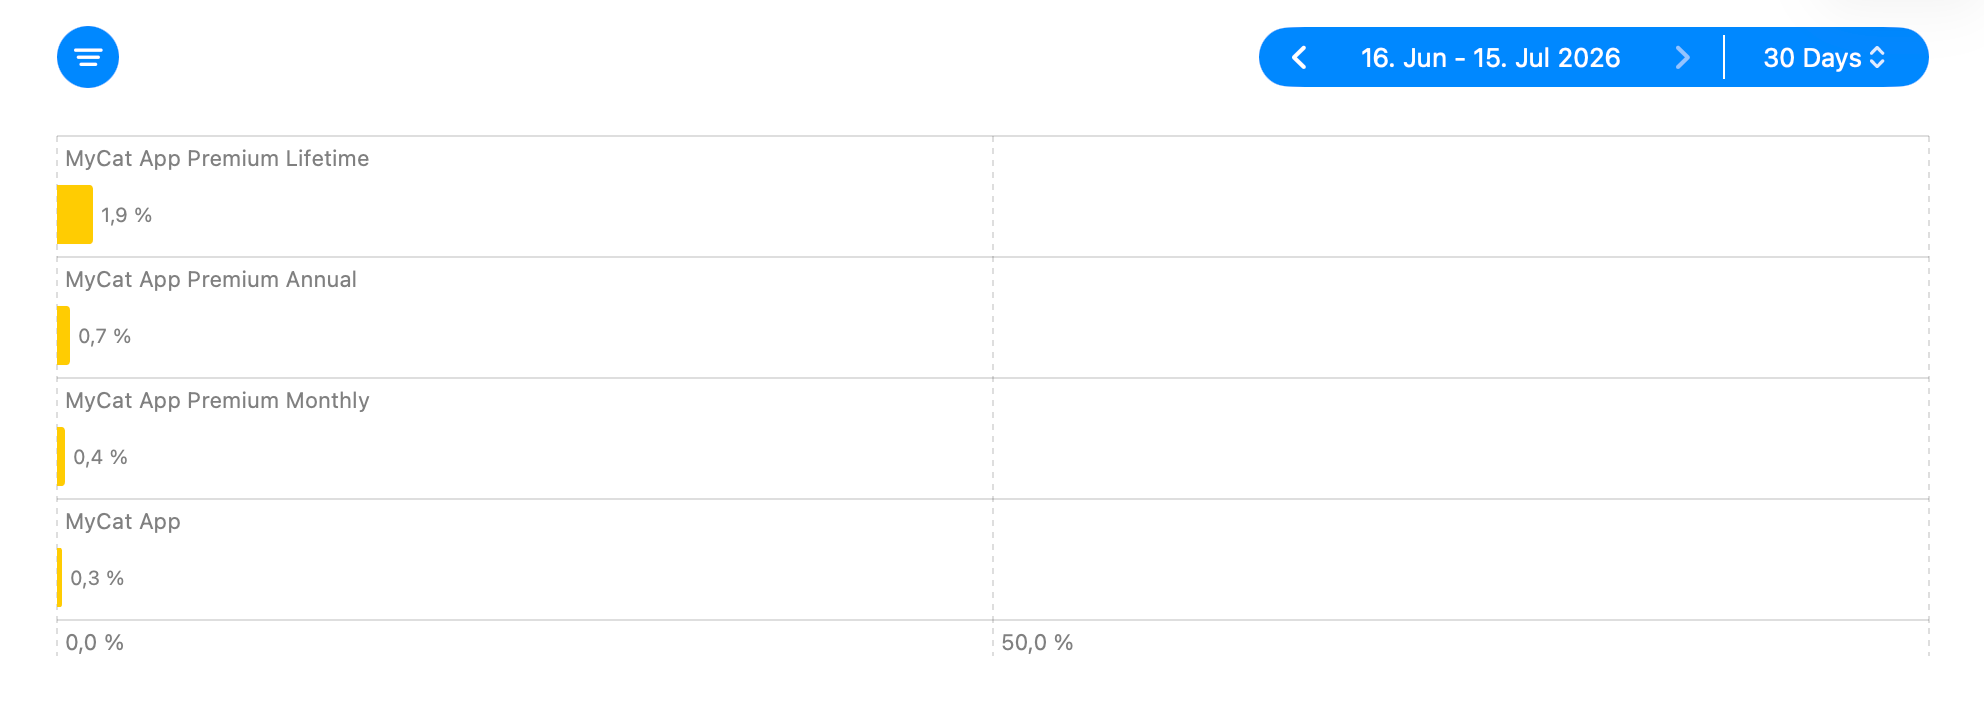
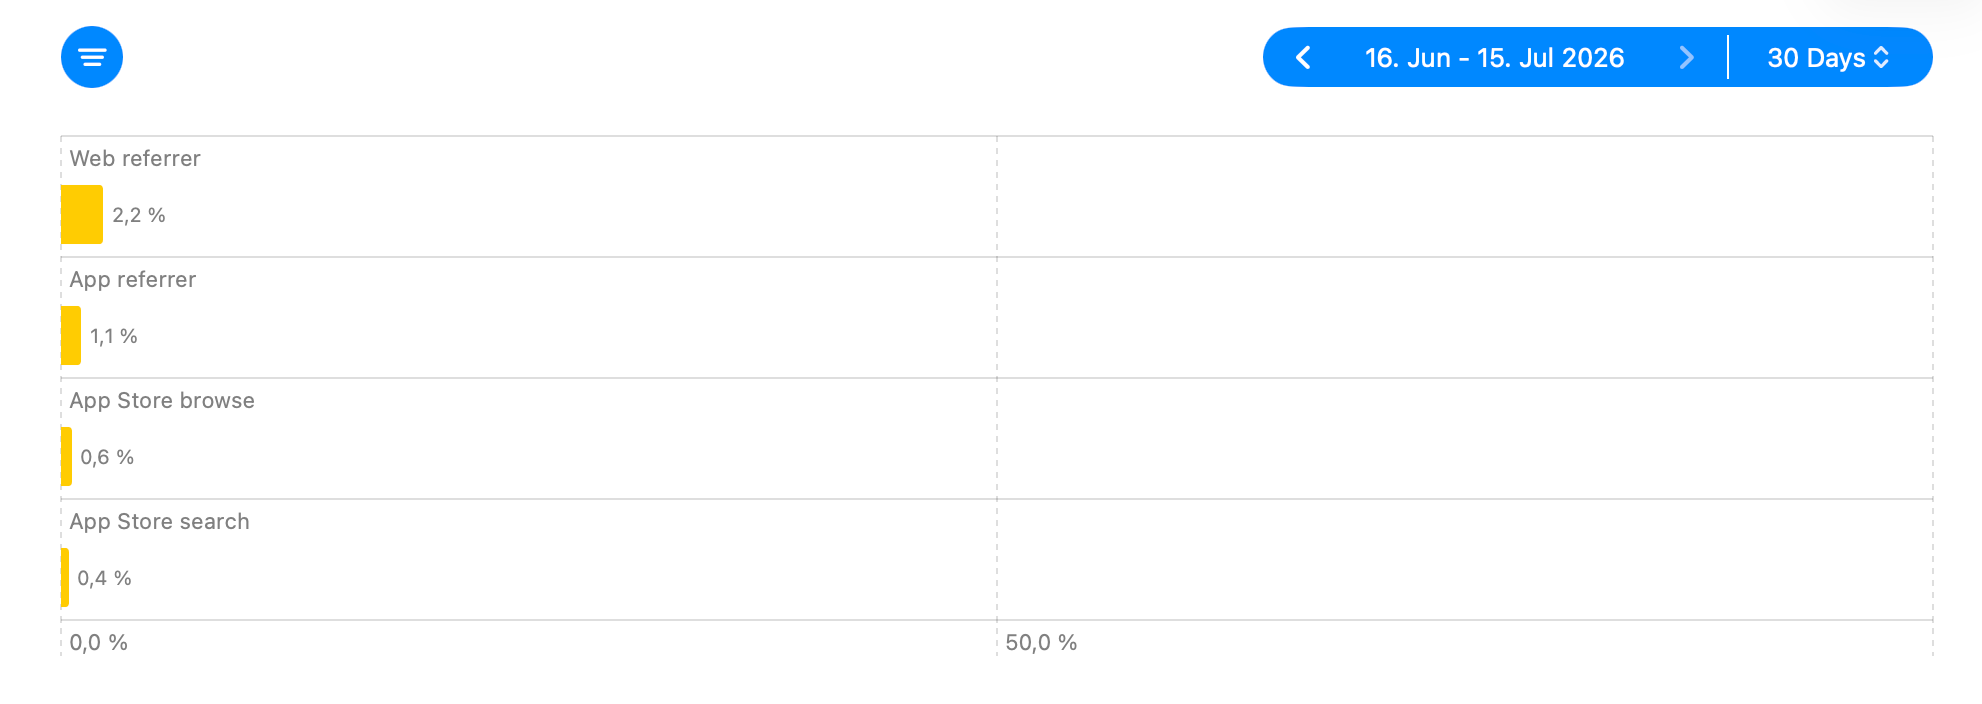
These breakdowns focus on complete refunds. Apple reports partial refunds with zero Purchases and negative proceeds, so they appear in Refunded Proceeds and the Proceeds Refund Rate but not in the purchase-based breakdowns.
Short periods can occasionally show a rate above 100% because Apple reports a refund when it occurs, while the original purchase may belong to an earlier period. Select a longer timeframe before treating such a spike as a trend.
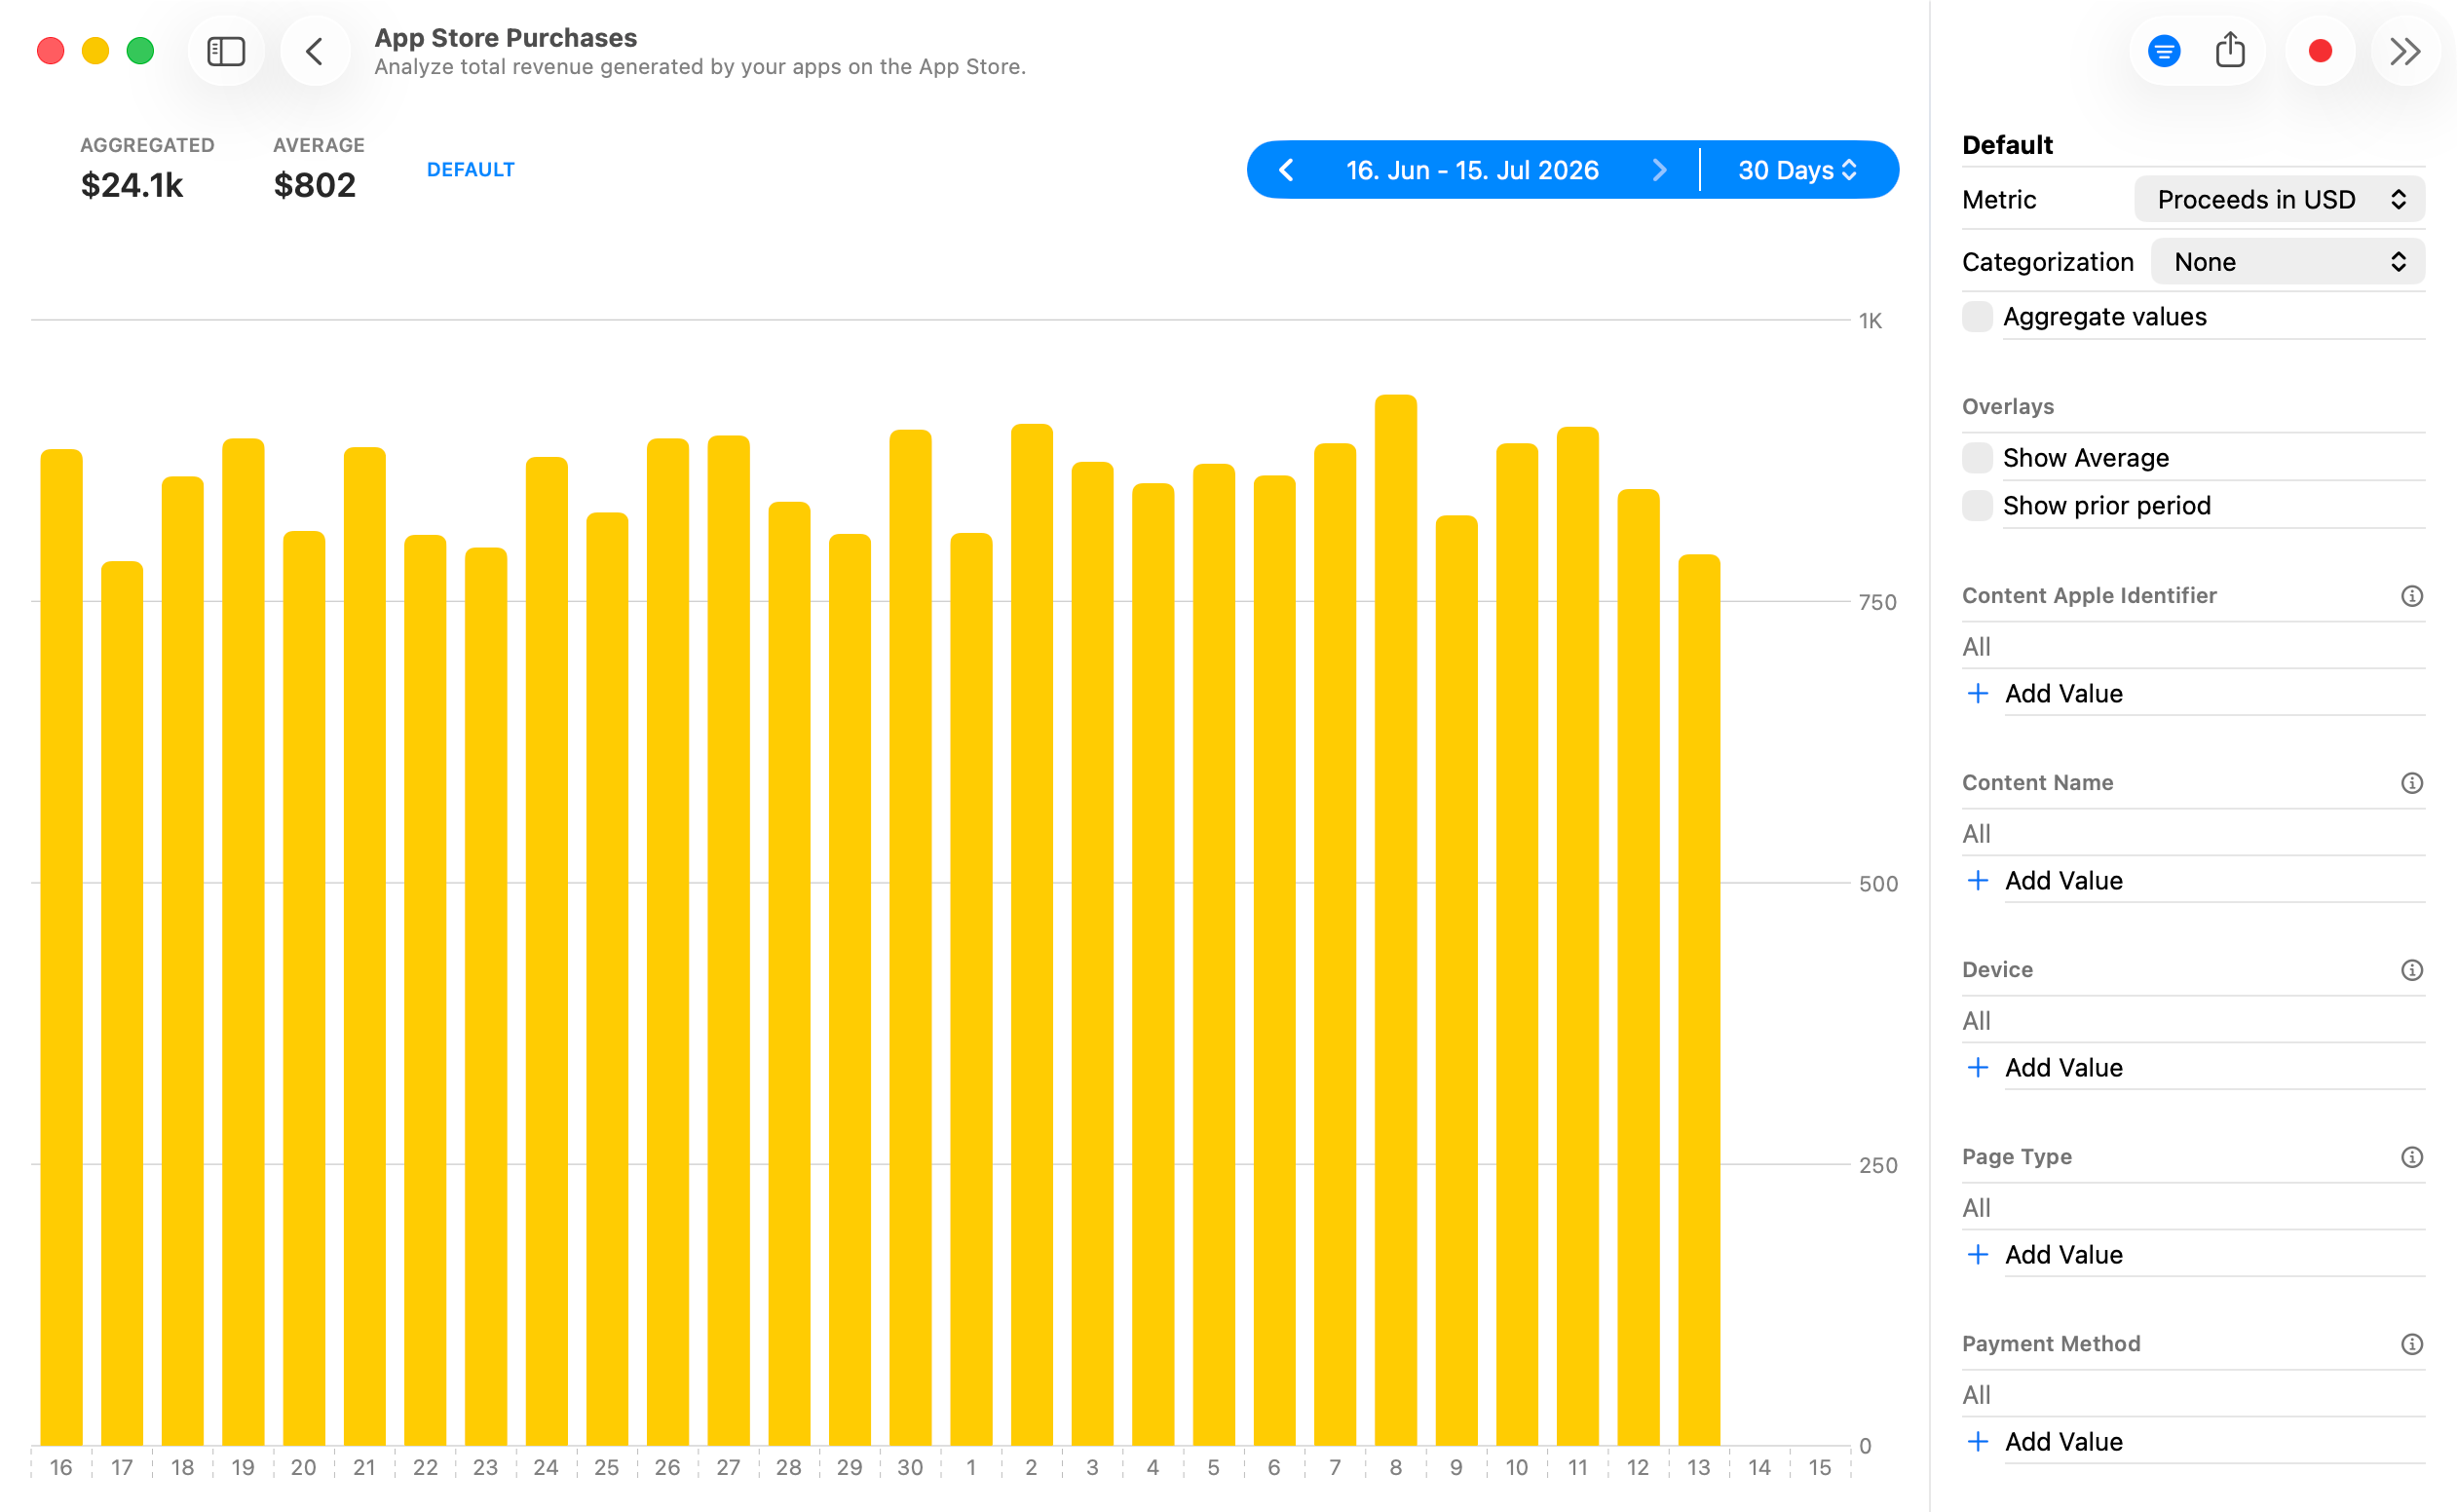
If the default views do not explain an unexpected change, you can inspect the raw purchase data directly. Open the relevant stat, click the magnifying glass in the top right, and categorize the result, for example, by Content Name, Purchase Type, Payment Method, Device, Platform Version, Source Type, or Territory. For repeated analyses, save the configuration as a custom preset.
Wrap Up
The Purchases report is most useful when you treat it as a path from one question to the next. Start with Total Proceeds to see what your app earned, then find the products and sources responsible for the result. Finish with a short refund check to confirm that both refund rates remain very low and stable.
If you have any more questions or ideas, don't hesitate to contact me via the form in the sidebar. Happy wizarding!