
Measure Retention Messaging Effectiveness
In summer 2025, Apple introduced the Retention Messaging API, enabling developers to show custom messages and offers on the screen where users can cancel their subscriptions. If you want to learn more about what the API is capable of and how it works from a developer’s perspective, you can read more here.
Alongside this API, Apple also introduced a handy new report: the App Store Retention Messaging report. In this guide, we take a look at how you can use ConnectWizard to check whether your messages are delivered correctly, compare save rates, and inspect the raw data behind your retention messaging performance.
Distribution
After setting up your messages, the first step is to check whether they are actually displayed to your users. To do this, you can use the Message Selection Type stat.
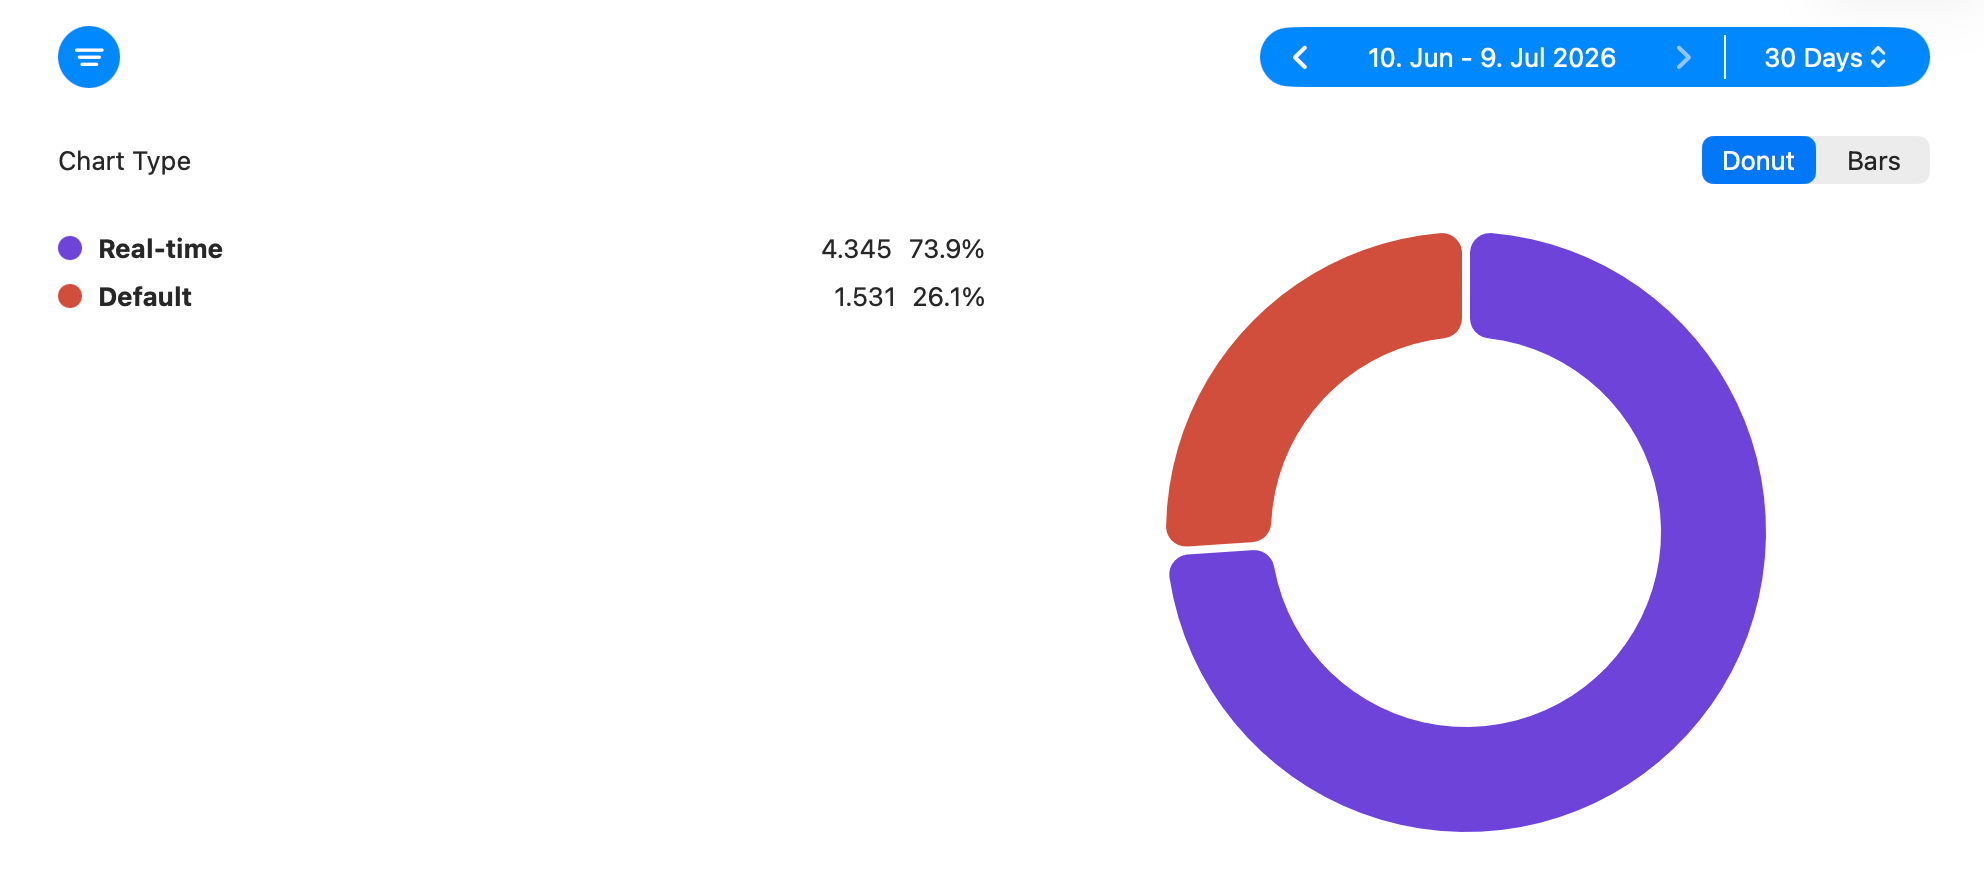
It shows the origin of the displayed message. If you use a realtime API to decide which message should be displayed, the realtime API source should make up most of the pie. If you do not use the realtime API, or if something is wrong with it, expect a high percentage of default, since your default messages are also used as a fallback for the realtime API. If you do not use the API yet, there may be no data at all.
If the messages are not delivered as expected, there are a few ways to narrow down the problem. First, for pie charts, you can always switch to a bar chart visualization to see whether the issue changed or grew over time. Second, you can filter the displayed values using the blue plus button in the top left. This allows you to filter, for example, by specific device types, operating system versions, or subscriptions, which may be the actual source of the issue. Last but not least, you can click the magnifying glass in the top right to open a much more versatile view for filtering, categorizing, aggregating, and inspecting the full raw data. All of these methods can be applied to every other stat in ConnectWizard as well, so there is much more to explore than it may seem at first sight.
Now that you know whether your messages are pulled from the correct sources, the next question is which configured messages are shown. Unfortunately, Apple does not provide the ID of the displayed message, but it does provide the type of the message. Use the Retention Message Type by Subscription stat to see which message types are used for which subscription.
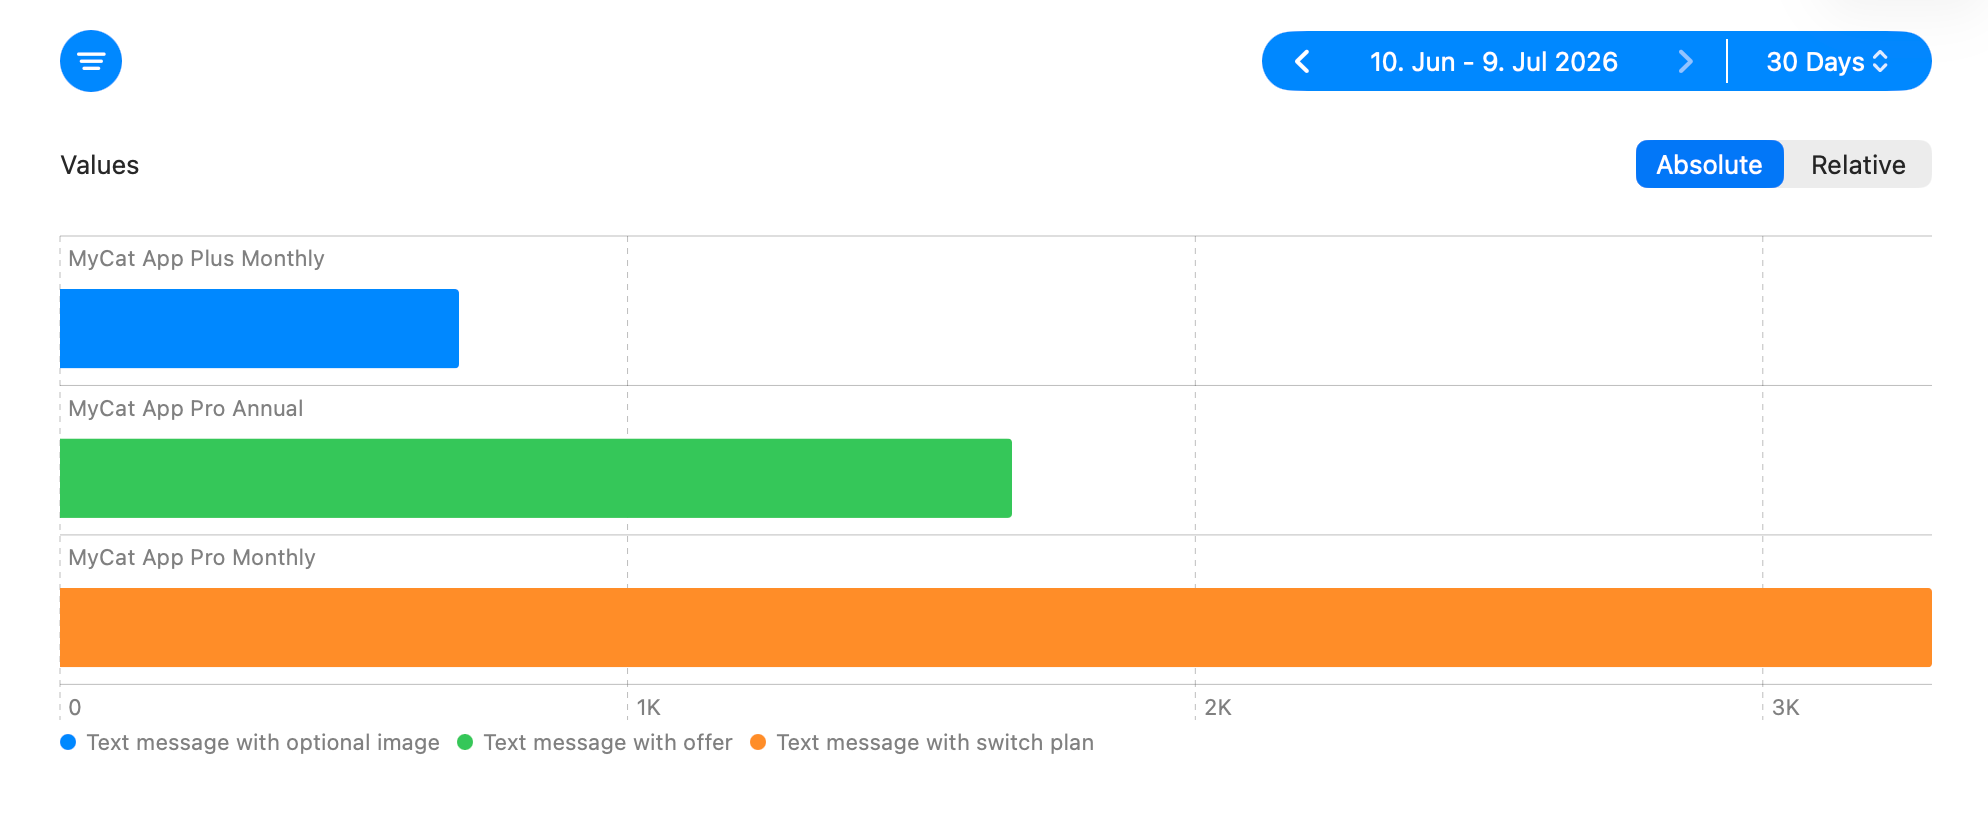
If you have only set up default messages or a fairly simple realtime API, you can expect a single type with 100% for each subscription. If your realtime API is more complex and uses custom logic per subscription, this stat tells you what the overall distribution looks like, without requiring any custom server-side tracking.
Success
Now that you know what users see when they are about to cancel their subscription, we want to measure the success of all the effort we put in. The most straightforward way to measure success is through the Save Rate stat.
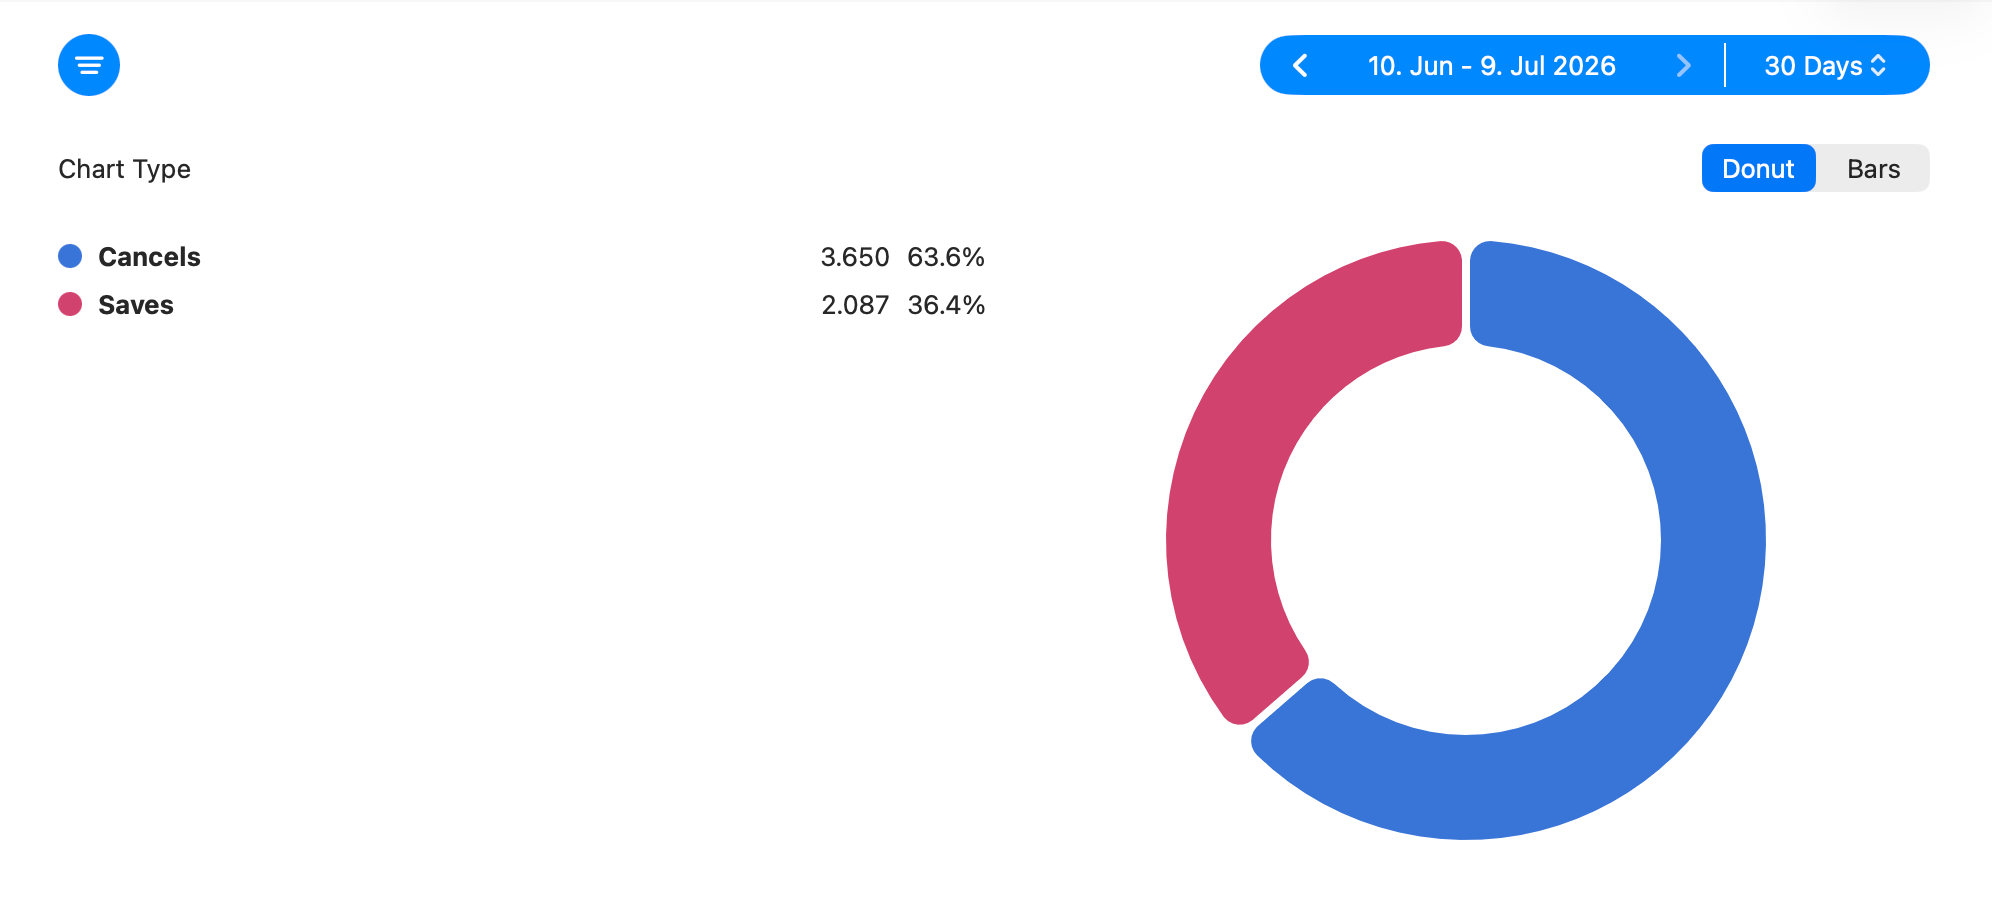
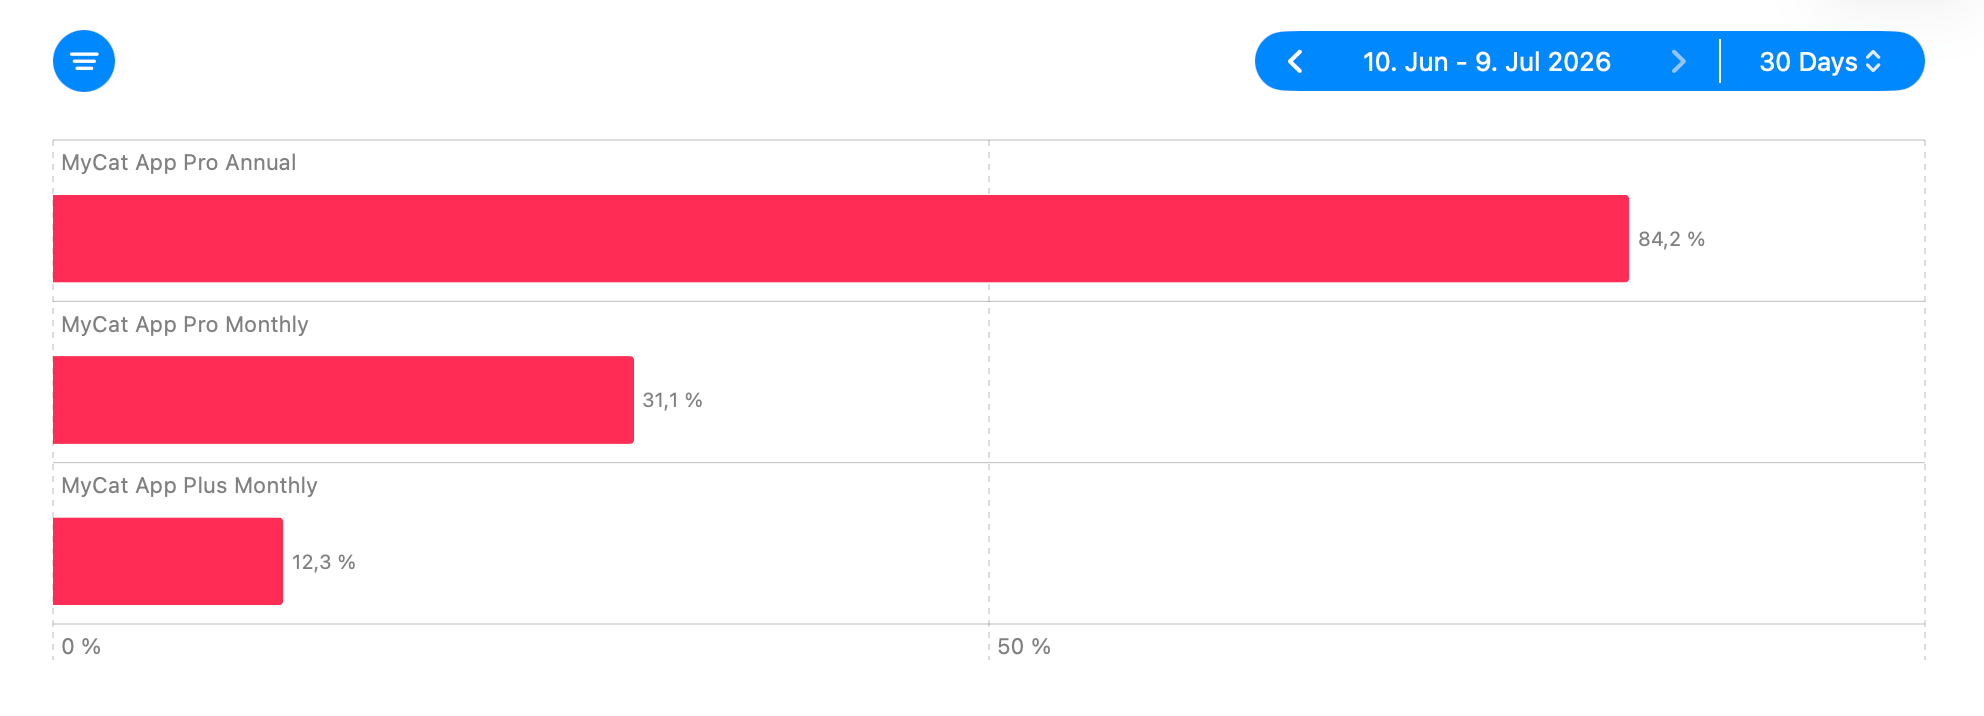
It gives you the save rate across all subscriptions and users. If you want a bit more detail, check Save Rate by Message Type and by Subscription, which break down the save rate by their respective dimensions.
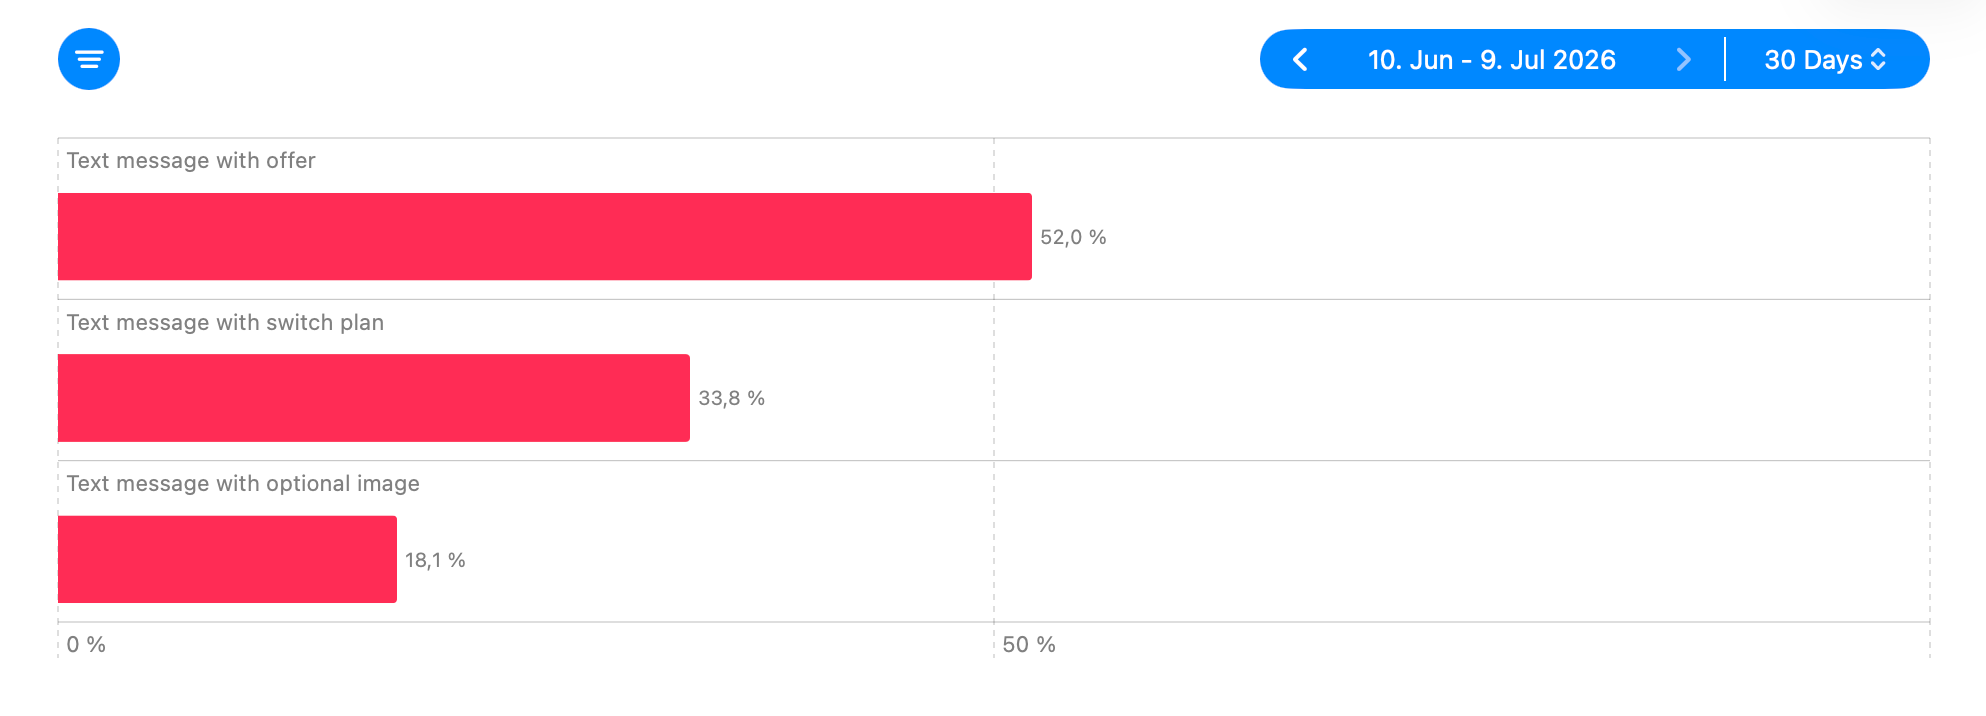
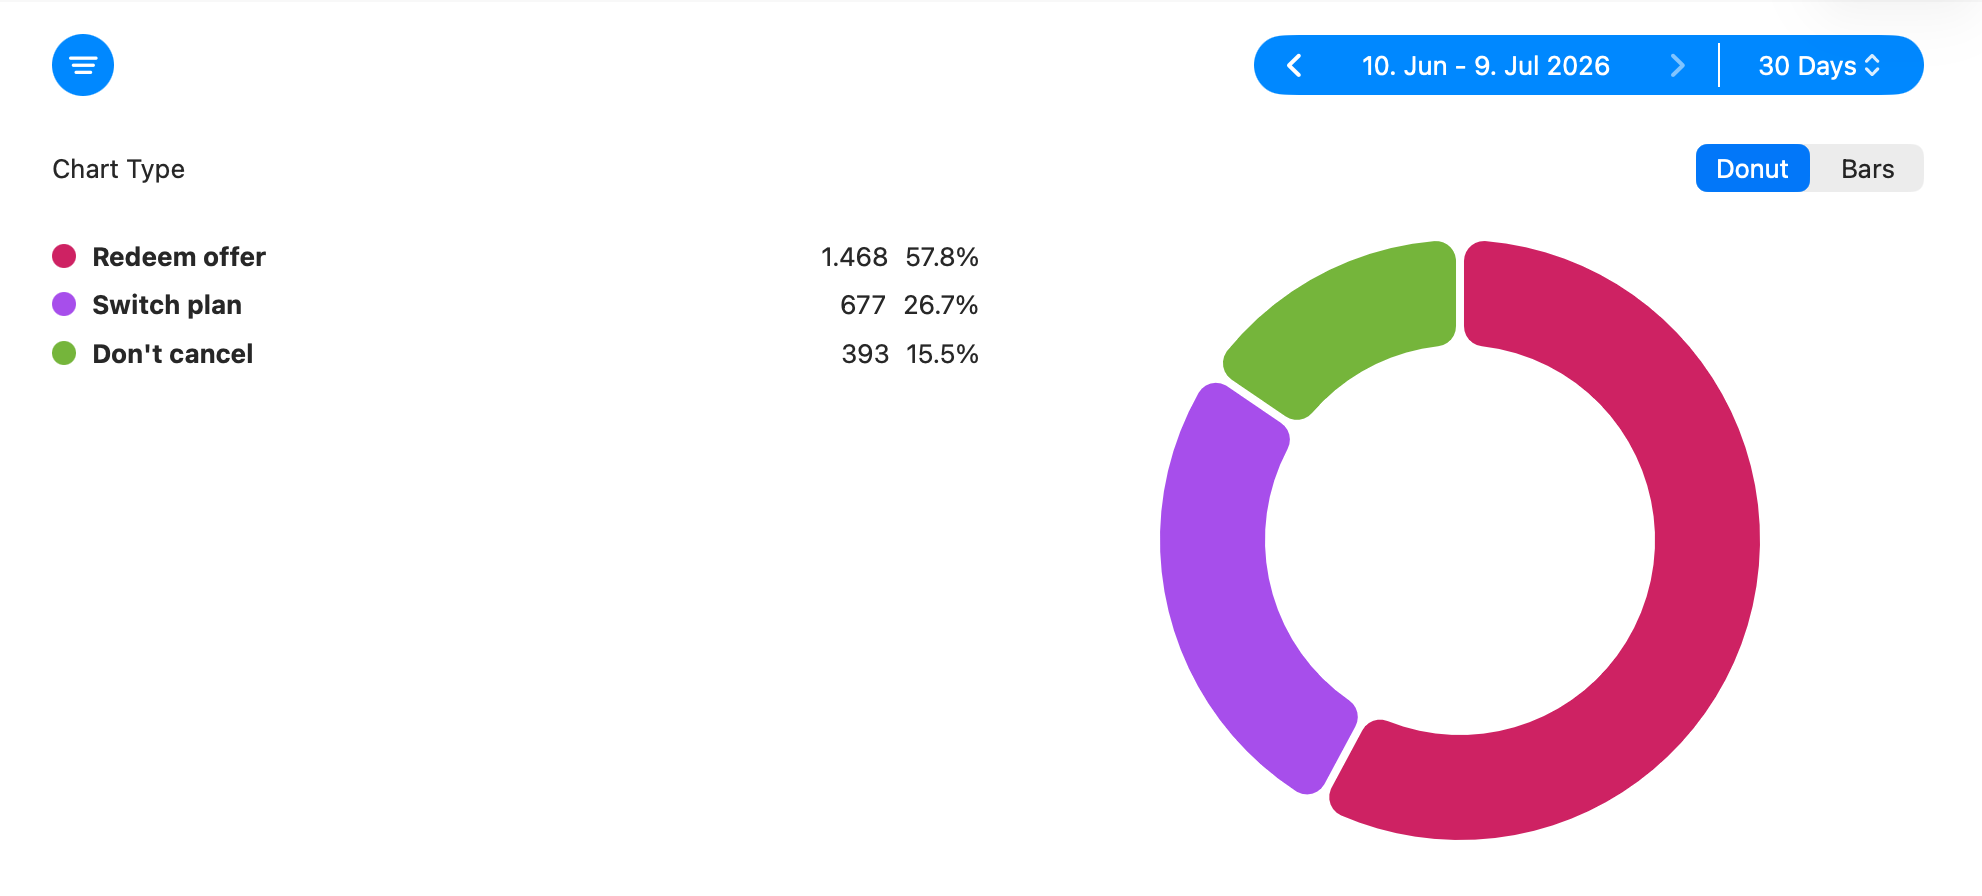
Another interesting stat is Save Type, which provides insights into how much each save option contributed to saved subscriptions.
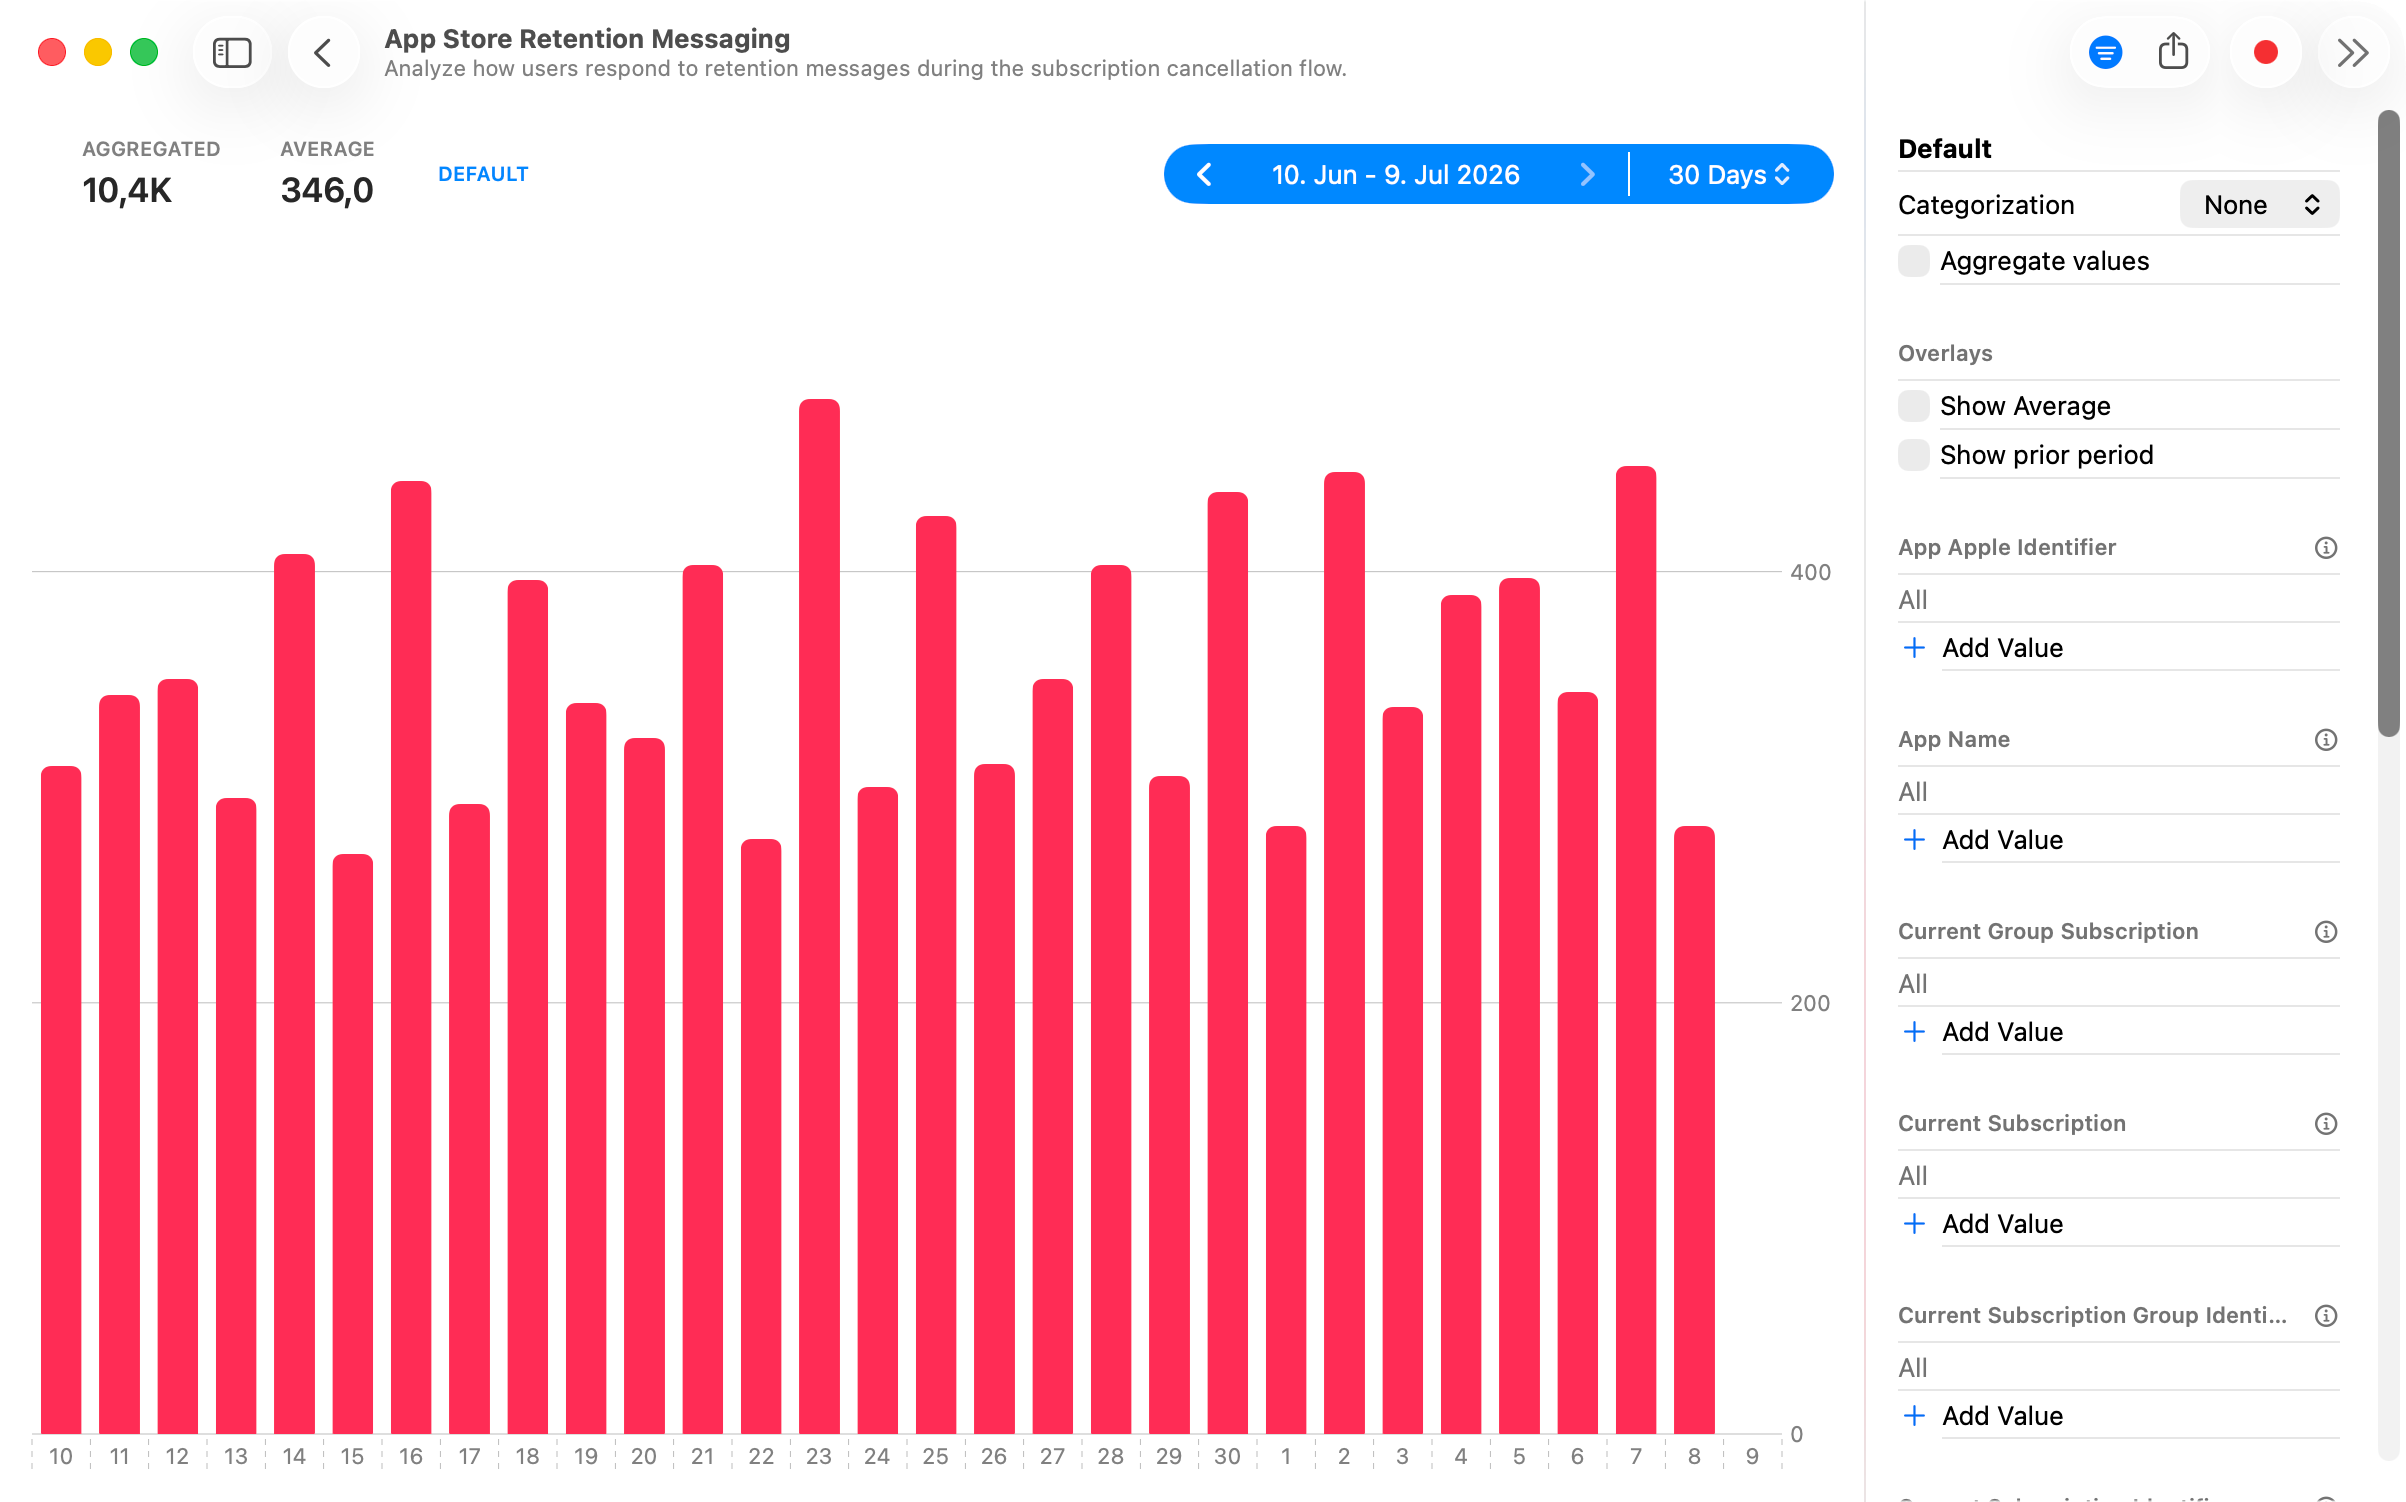
If the existing data and visualizations do not match your needs, you can also query the raw data directly.
Within the raw data view, you can apply as many filters as you want across all available columns. If you add multiple values for the same property, they are treated as OR values. If you want to split your data by a certain property, for example by device, you can use Apple’s categorization for the property of your choice. If you want to easily reuse the same settings for this report type in the future, you can save them as a custom preset at the bottom of the inspector. A saved preset is then displayed at the top of the window next to the aggregated value, the average, and the default view. Simply tap on it to reapply the preset, or modify it via the inspector on the right.
Wrap Up
Retention messages can be a powerful tool to reduce churn, but only if they are shown in the right situations and work as intended. With the App Store Retention Messaging report, you can verify your setup, understand how your configured messages are distributed, and measure whether they actually help save subscriptions. ConnectWizard makes this easy by turning the raw report data into clear charts, filters, and presets you can revisit whenever you want to check or compare your retention messaging performance.
If you have any more questions or ideas, don't hesitate to contact me via the form in the sidebar. Happy wizarding!